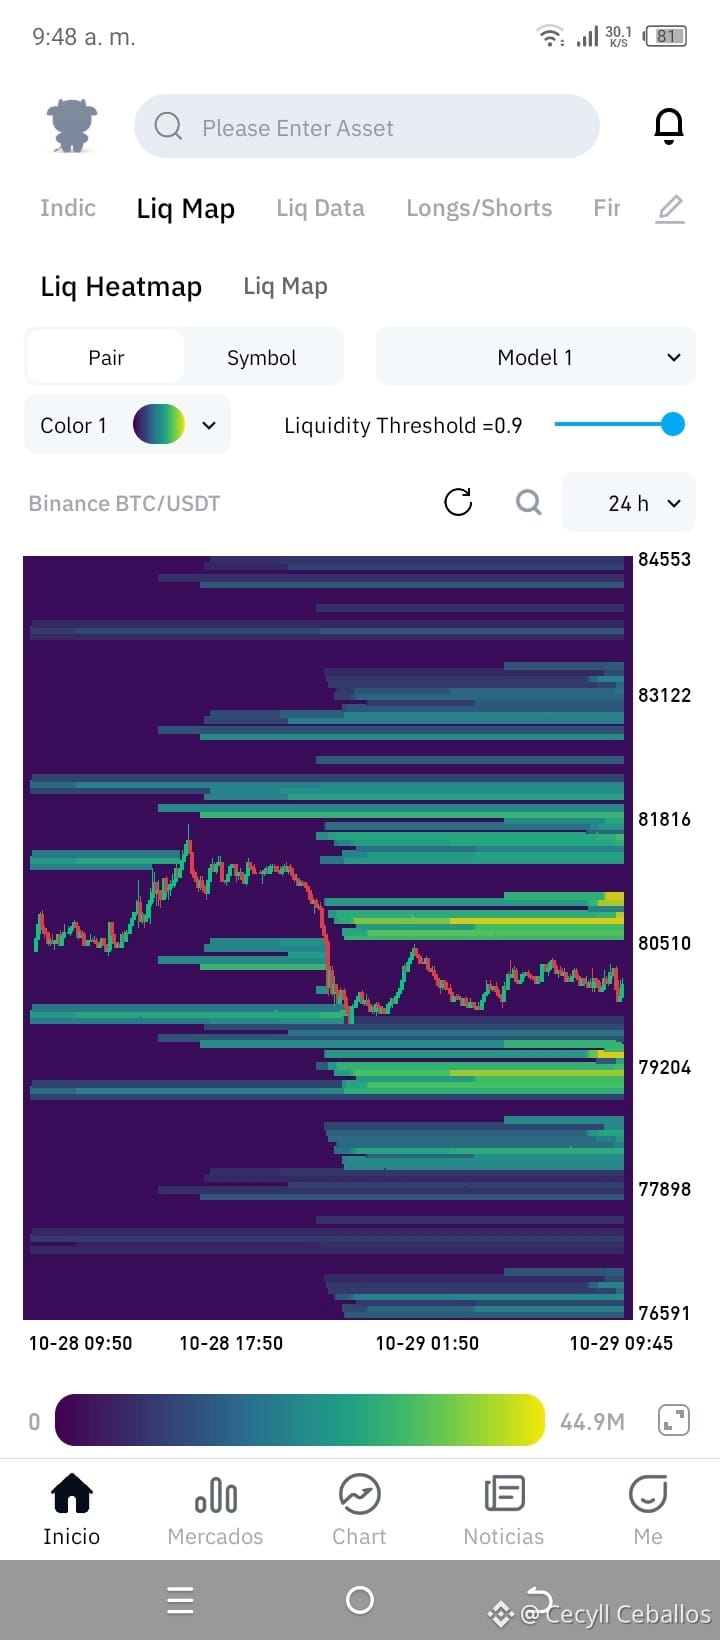
🚨 MARKET ANALYSIS: BITCOIN (BTC/USDT) LIQUIDITY HEATMAP AND MACRO CONTEXT 🚨
Technical review of the 24-hour chart and the news catalysts moving the Bitcoin market today:
📊 1. BTC/USDT Heatmap Overview
Long position sweep: After the move above $82,200, the market made a quick correction that broke below $80,000 and bottomed in the $79,500–$79,800 zone, sweeping out the leverage that had been positioned for a rise.
The upper liquidity wall: The $80,500–$81,000 band shows a dense concentration of liquidity in bright green/yellow. This block currently acts as the main technical resistance and liquidation magnet for short positions. If this range is broken, the next liquidity pool is between $81,800 and $83,100.
Key support zones: Below, $79,200 marks the immediate line of defense. If selling pressure breaks through this level, the next target with available liquidity is in the $77,800–$76,500 range.
📰 2. News Context and Market Flows
Spot ETF inflows: Bitcoin ETFs in the United States once again posted a positive net balance, accumulating more than $286 million in inflows over the past 48 hours, led mainly by BlackRock's IBIT fund, which has halted the outflows recorded mid-month.
Macroeconomic outlook: The market is trading cautiously as it digests the Federal Reserve's (Fed) interest rate decision and tone. This wait-and-see approach coincides with Bitcoin's price consolidating around $80,000–$81,000.
Sentiment and risk appetite: The technical rebound in tech stocks has supported risk assets, although overall volume remains cautious as the market awaits confirmation of a breakout or rejection at the immediate resistance levels.
If you like my analysis, give it a like; if you follow me, I'll follow you.
$NVDAB $DOGE
#Bitcoin #BTC #CryptoNews #BinanceSquare