Gold at $4,045—would you dare buy the dip?
From 5,500 down to 4,045, a 30% drop. Everyone’s saying the safe-haven myth of gold has collapsed. But central banks have been quietly buying gold for 12 consecutive months—is 4,000 a trap, or a golden buying opportunity?
First, the surface picture: a barrage of bad news, but 4,000 hasn’t broken.
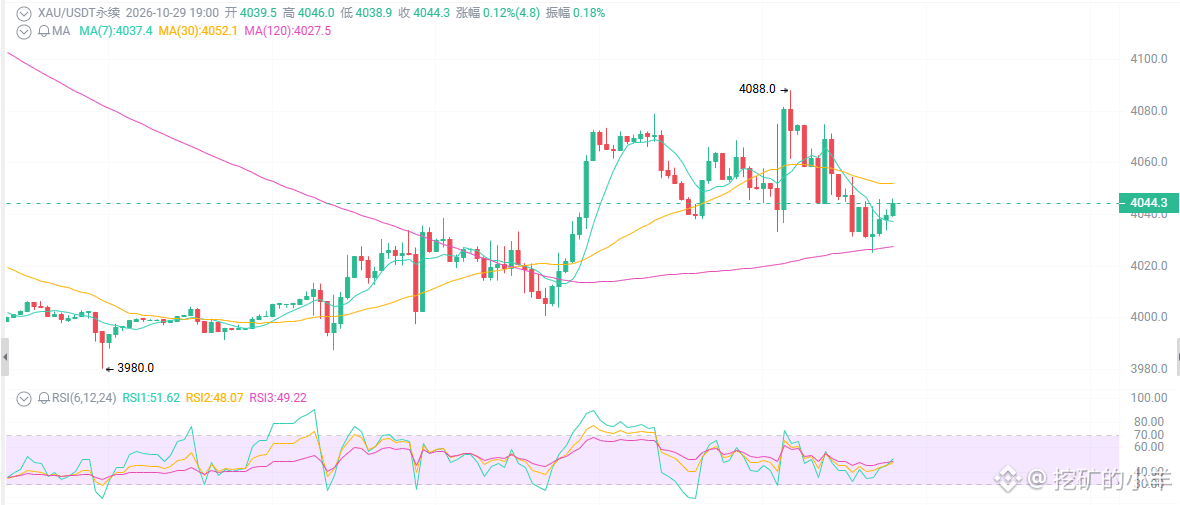
The Fed just wrapped up its meeting on October 28, keeping rates unchanged at 3.75%–4.00%. The vote was 10–2, with two members favoring a rate hike—a hawkish signal. The probability of a December hike is still above 80%. The dollar index is hovering around 102, Treasury yields are elevated, tensions in the Middle East are pushing oil prices higher, and inflation worries are keeping the Fed from easing its stance. In theory, gold should be crumbling. But it’s just grinding back and forth between 4,000 and 4,060, with intraday lows of 4,016–4,025 and highs of 4,067–4,080. It can’t fall further, but it can’t rise either.
First point: The more hawkish the Fed, the harder it is for gold—but the market is starting to tune it out.
High interest rates mean a high opportunity cost for holding gold: money in the bank earns 4% interest, while gold earns nothing. That’s the main reason gold fell from 5,500 to 4,000 over the past six months.
But notice one detail: after all this bad news, 4,000 still hasn’t broken.
The same hawkish signal caused a 3% drop the first time, a 1% drop the second time, and then the market moved sideways the third time. That’s what it means for bad news to lose its impact. Retail investors are still complaining that “gold has failed as a safe haven,” while central banks have been buying continuously below 4,000 for 12 months.
Second point: Gold isn’t a safe-haven asset right now—it’s an “anti-Fed” asset.
War breaks out in the Middle East. Should gold rise? Not necessarily. Oil prices rise → inflation proves stickier → the Fed turns more hawkish → the dollar strengthens → gold comes under pressure instead.
So if you’re buying gold now, you’re not betting on geopolitical conflict. You’re betting on when the Fed will finally concede.
Institutions have already lowered their year-end 2026 targets, but most expect a rebound to 4,500+ in 2027. The short term may still be rough, the medium-term bottom has support, and central banks are providing a floor in the long term.
Third point: Technically, 4,000 is the line separating bulls from bears. No debate.
Daily/weekly charts: The price is below the 20-day moving average (4130+) and the 50-day moving average. Bearish MACD momentum is still in place, and the RSI is neutral to weak. After a big bearish weekly candle, the rebound has been feeble. 4,000 is both psychological and technical support, and it has held several times. If it gives way, watch 3,975–3,940.
4H/1H: Trading sideways in the 4,020–4,060 range, with average volume. Rallies that fade are the norm. The structure is still dominated by bears; rebounds are just corrections.