#bitcoin ($BTC /USDT) Chart Analysis: Preparing for the Next Big Move?
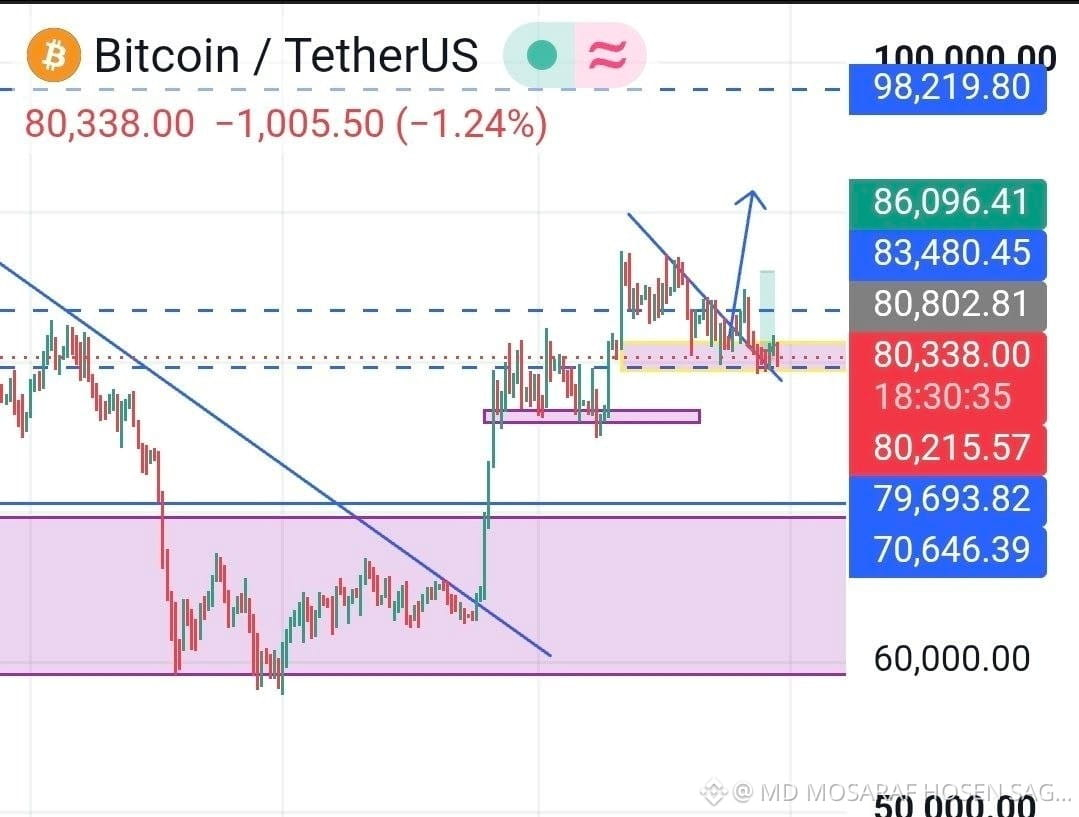
The Bitcoin (BTC/USDT) chart is currently at a very fascinating juncture for crypto traders, with the price trading around 80,338.00 (-1.24%).
Base Formation & Market Trap: The chart shows a strong recovery following previous deep drops, a movement that often acts as a liquidity grab or bear trap before a strong continuation.
Consolidation Phase: The price is currently consolidating within a tight range (roughly between 80,215.57 and 80,802.81), gathering momentum.
Potential Breakout Targets: Technical indicators suggest that if the price breaks above the current descending resistance line, it could rapidly target the 83,480.45 and 86,096.41 resistance levels. In the longer run, targets look towards 98,219.80 and the psychological 100,000.00 milestone. #BinanceSquare