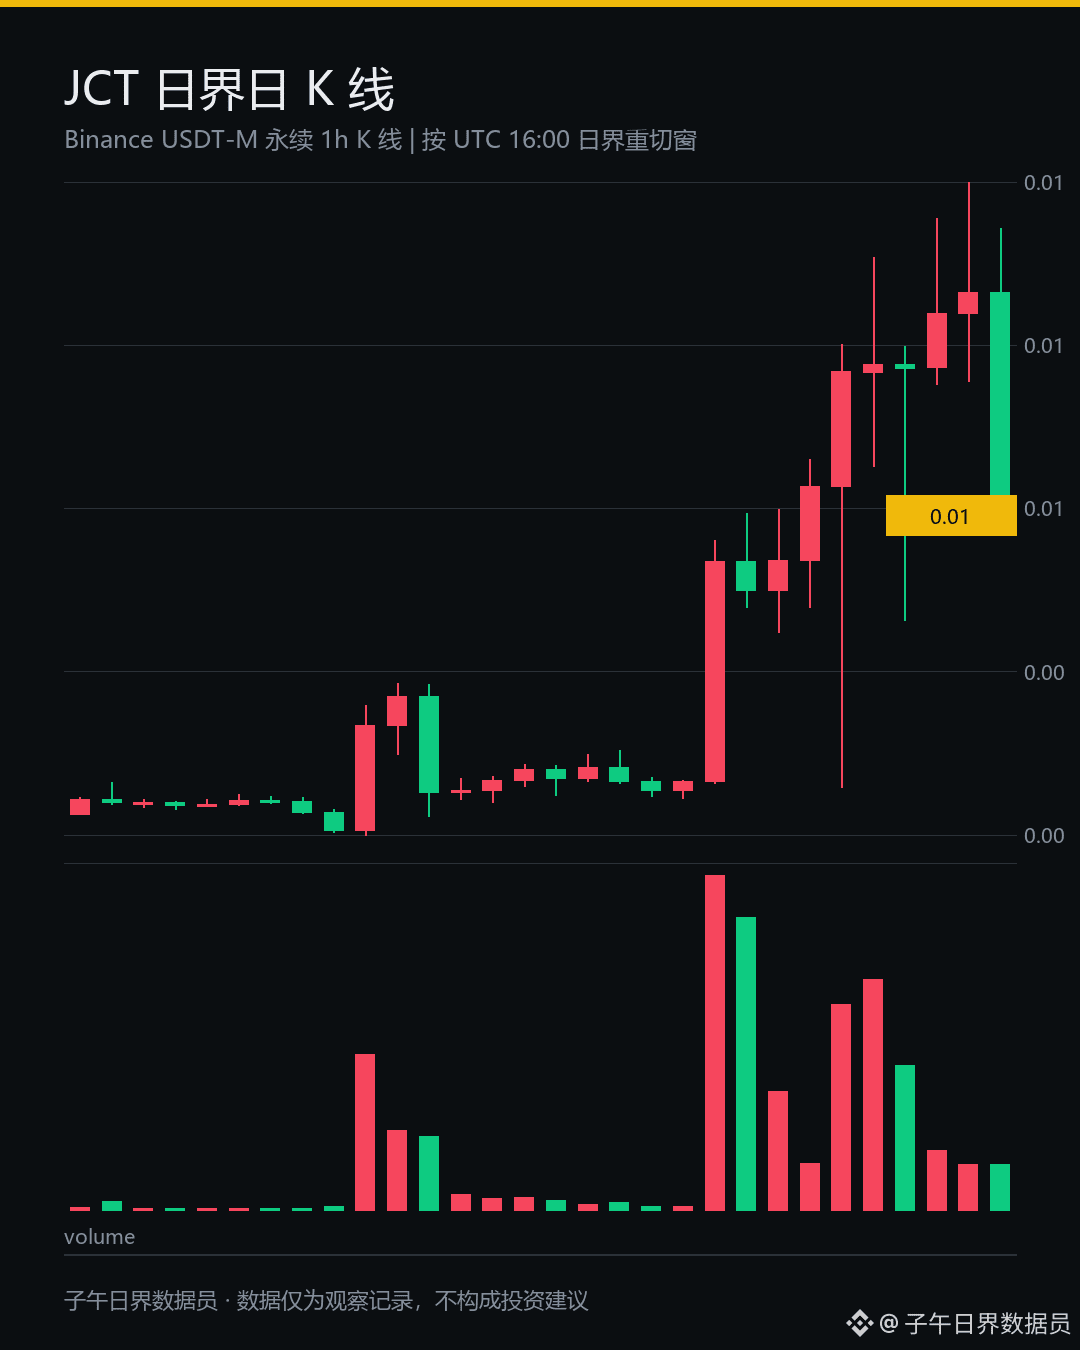
Everyone, JCT's daily chart looks pretty ugly.
It closed at 0.007749 yesterday. Today it hit a high of 0.008596 and a low of 0.005037,
and is currently at 0.005174. It's given back 31.087% in 24 hours, with a 70.657% range,
and is still 39.809% below its 24-hour high.
Ten days ago, it closed at 0.001982.
Over those ten daily candles, it went from 0.001982 to 0.005174, a total gain of 161.049%,
with the seven-day gain now at 14.418%. This rally was fueled by money: 24-hour trading volume was 137.59 million USDT,
and volume hasn't dried up.
The position is the problem.
The range over the previous ten daily candles was 0.001837 to 0.00916. The current price sits at the 45.57th percentile,
neither near the top nor the bottom. Nobody wants to bet heavily at a level like this.
It's like a pot of water that just boiled being doused with half a ladle of cold water: the steam is still there, but the heat is fading.
The pot is only so big. Whoever is closest gets served first, and those who got out early have already cashed in their paper profits.
The funding rate is still positive at 0.005%. Longs are paying to keep shorts afloat, the positions haven't been fully shaken out, liquidity is still draining, and the disagreement hasn't eased at all.
My take is straightforward: I won't call a direction from the middle of the range.
A break below 0.005037 would count as a real breakdown. It needs to reclaim 0.006376 before it has the strength to recover.
At first glance, I thought the price data had been mixed up. I checked twice before believing it could gain 161.049% in ten days.
What do you make of this daily candle? Let's talk in the comments.
$JCT
$BTC $ETH
#JCT #比特币 #Cryptocurrency
The above reflects my personal trading-system notes and observations of the data. It does not constitute investment advice.