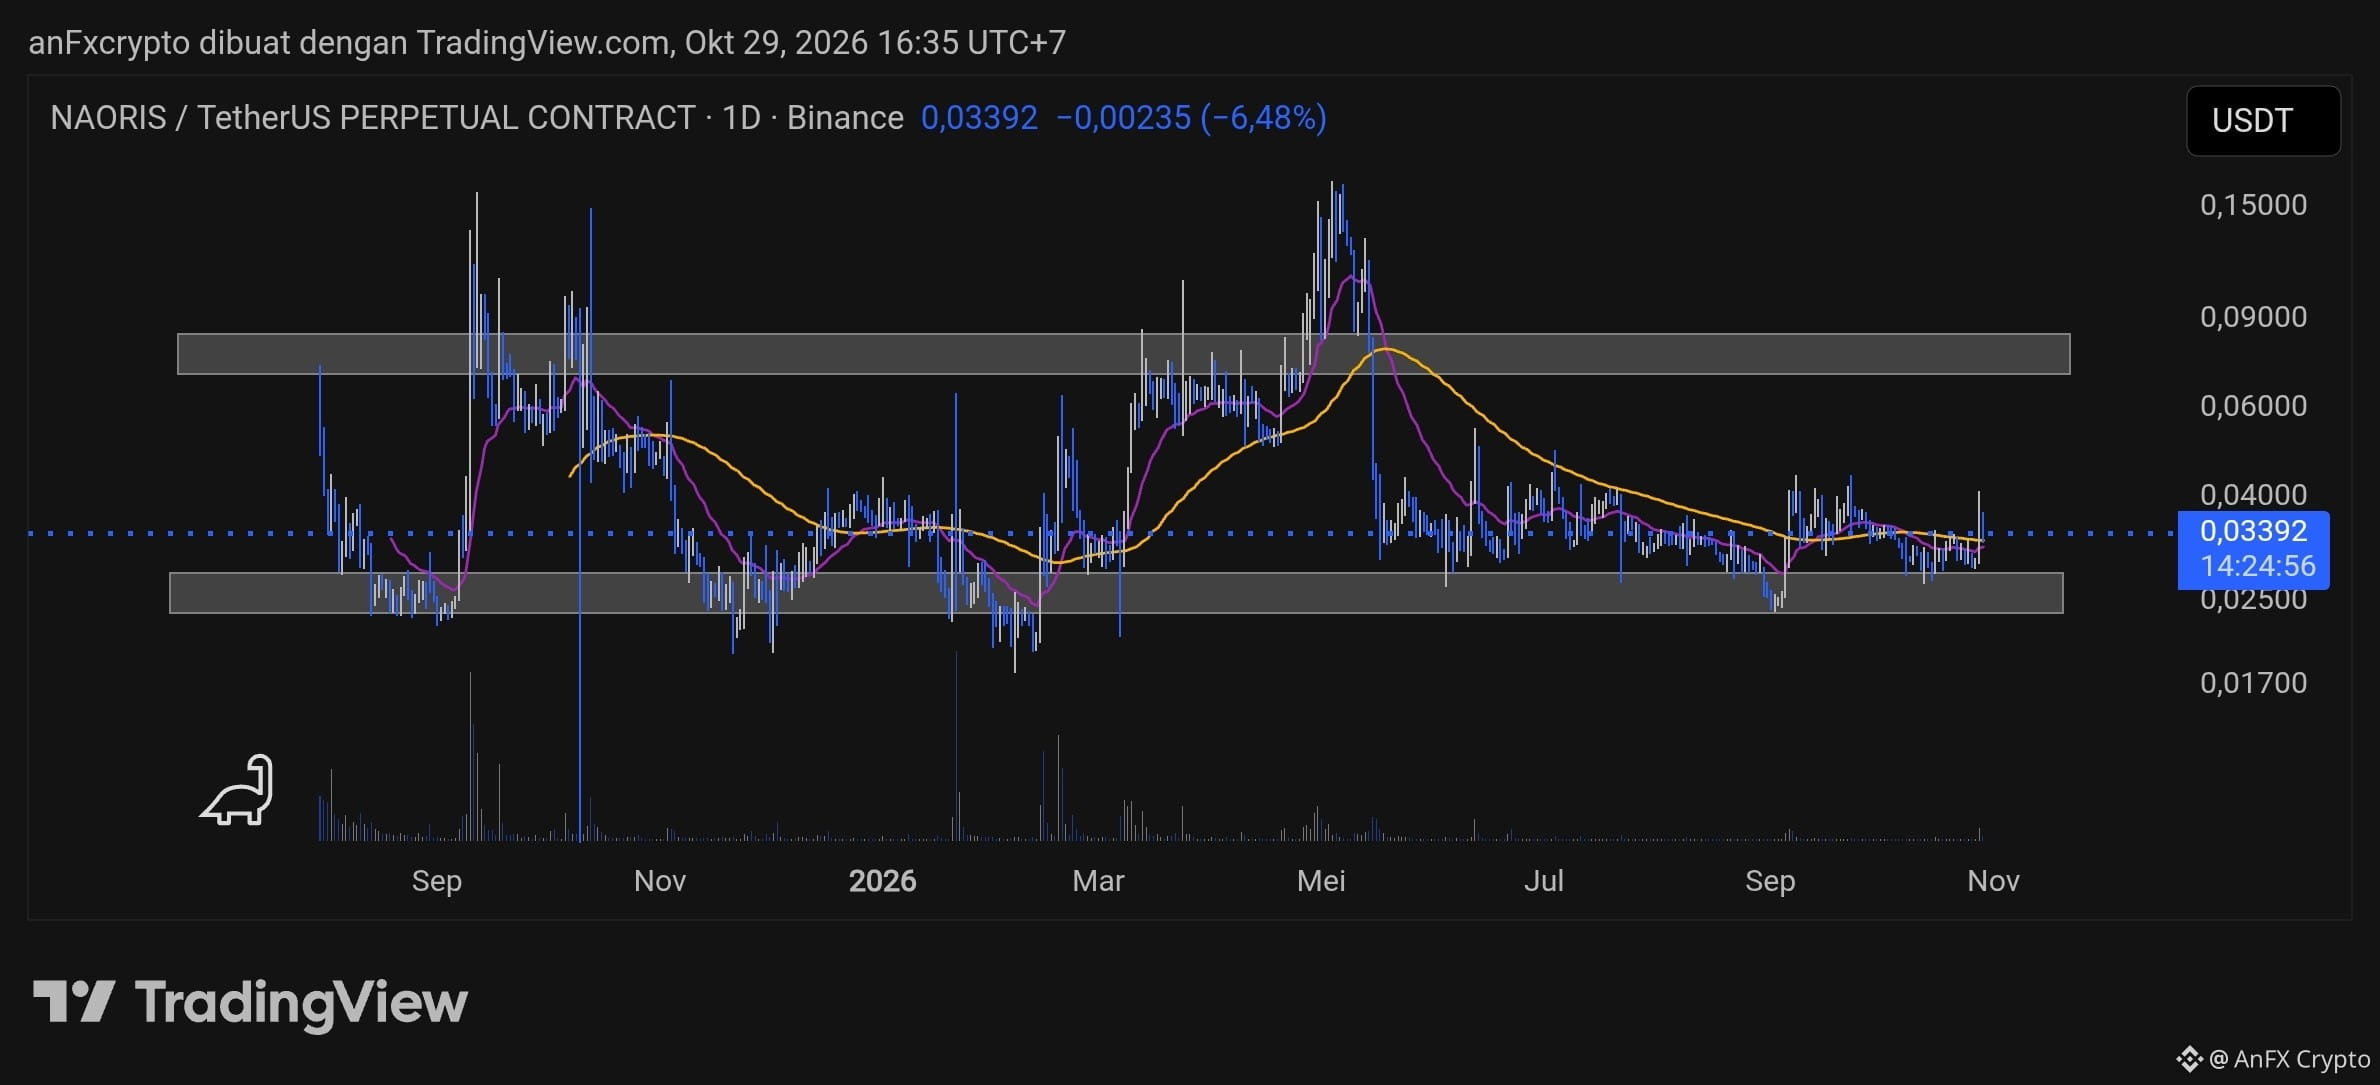
Technical Analysis $NAORIS /USDT (Daily Timeframe / 1D)
Based on the daily chart of NAORIS/USDT perpetual contract price movements, here is an analysis of the market structure and a trading signal plan:
1. Market Structure & Indicator Analysis
Price Structure (Range-Bound / Consolidation): The price is currently around 0.03392 USDT. Price action appears to be consolidating within a trading range (the gray box) between lower support around 0.02500 USDT and upper resistance in the 0.07000–0.08000 USDT range.
Moving Average (MA) Indicator: The trend indicator lines (yellow and purple) are moving sideways (flat), indicating that macro momentum is in a consolidation or sideways phase following a prolonged correction from the previous high.
Volume: Trading volume is low, suggesting that the market is waiting for a catalyst or a valid breakout from the consolidation range.
2. Trading Signals (Buy/Long & Sell/Short Setups)
Since the price is in the middle of the consolidation range with a neutral, consolidation-leaning bias, the best strategy is to wait for the price to approach the range boundaries (support/resistance) or take advantage of a breakout.
Option A: Swing Rebound Strategy (Mean Reversion - Buy/Long)
Entry Area (Buy): 0.02800–0.03100 USDT (near the lower support boundary).
Stop Loss (SL): Below 0.02400 USDT (if a breakdown below strong support occurs).
Take Profit (TP):
TP1: 0.04000 USDT
TP2: 0.05500 USDT
Option B: Breakout Strategy (Momentum)
Confirmation: Wait for a daily candle to close convincingly above the local resistance line or above 0.04500 USDT, accompanied by a volume spike.
Further Target: Toward the 0.06500–0.07500 USDT area.
Risk Note: Always use strict risk management (a maximum of 1–2% risk per position), given the volatility of small-cap crypto assets in perpetual futures contracts.