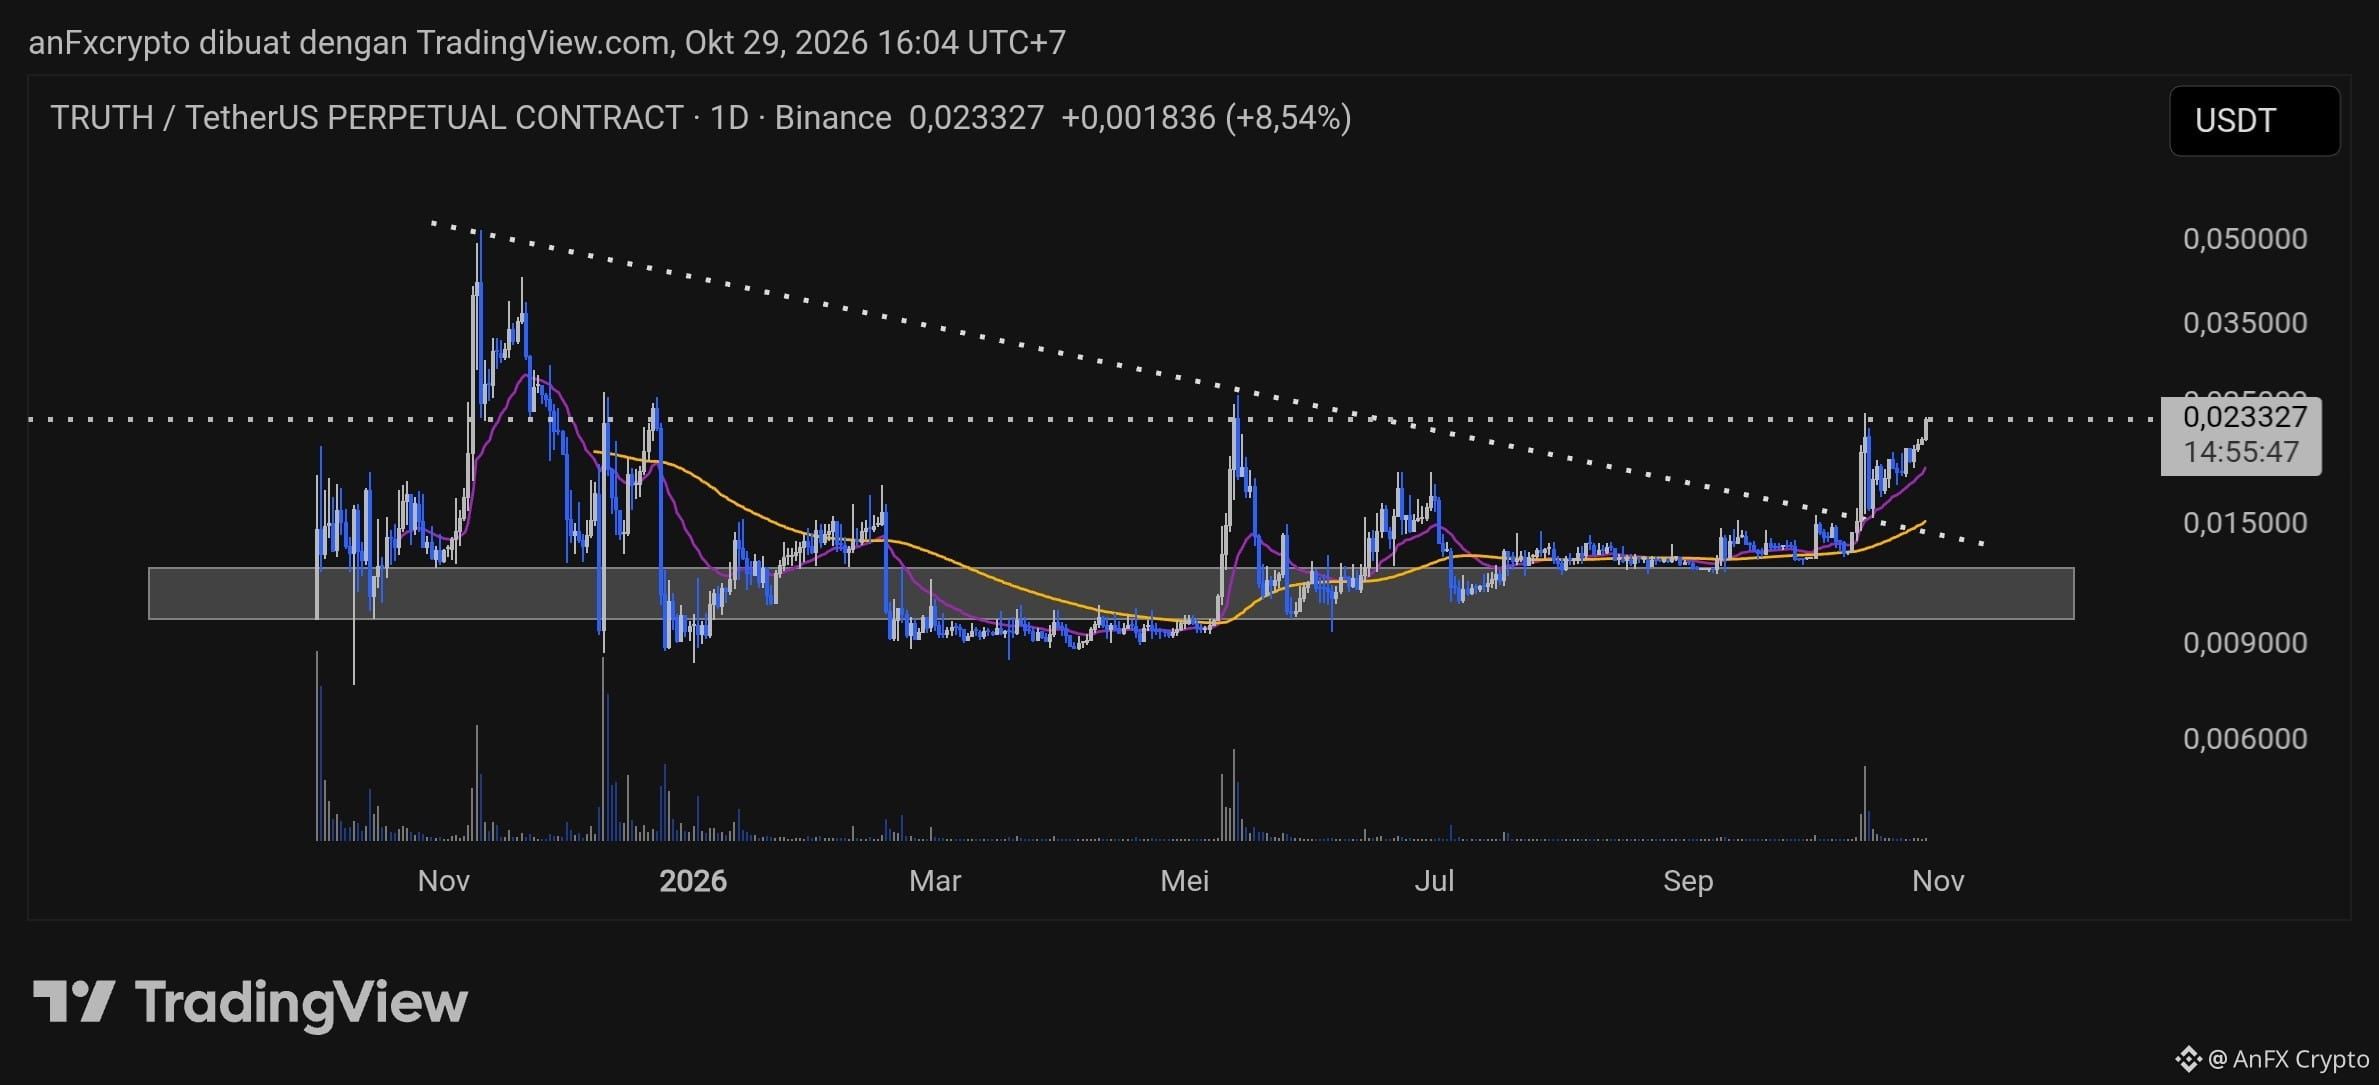
Technical analysis on the 1D chart $TRUTH /USDT.
Trend Structure & Pattern: The price has just successfully broken above the long-term descending resistance line that has been in place since late 2025.
Moving Average Indicator: The short-term MA is above the long-term MA and sloping upward, indicating strong short-term bullish momentum.
Support & Resistance Areas:
Nearest support in the 0.015000 - 0.018000 range.
Next crucial resistance in the 0.035000 range.
Trading Signal (Long):
Entry (Buy): 0.022000 - 0.023327 (current price), or wait for a healthy pullback toward the 0.020000 area.
Stop Loss (Limit Risk): 0.016500 (below the recently broken trend line).
Take Profit (Profit Targets):
TP1: 0.030000
TP2: 0.045000
Risk Management Note: Given the volatility of small-cap crypto assets, use prudent position sizing and always apply a stop loss.