$ETH #ETH走势分析
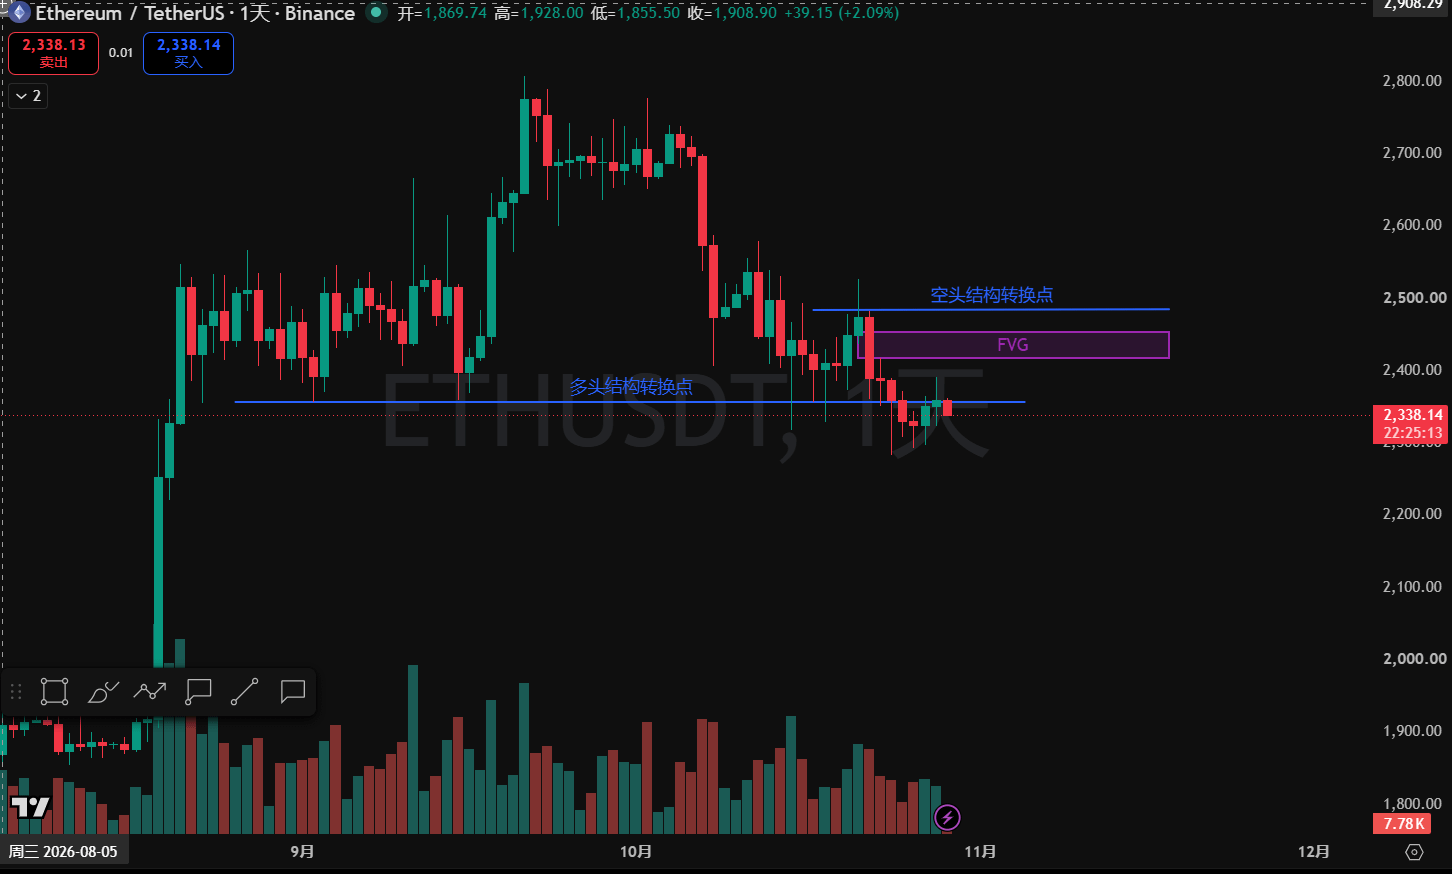
Daily chart: Yesterday’s close formed a rebound doji on unchanged volume, with no need to follow through with an entry. Given that the current trend remains downward, the short-term outlook is still bearish, and the short-term target remains 2000. Even if you want to go long and a rebound occurs, 2437 and 2485 are both strong resistance levels overhead. A stop-loss would need to be placed below 2270, making the risk-reward ratio very poor. Therefore, both spot positions and long-term long positions should continue to wait. The prerequisite for going long is for price to hold firmly above and break through 2490, the level where the overhead bearish structure would shift.
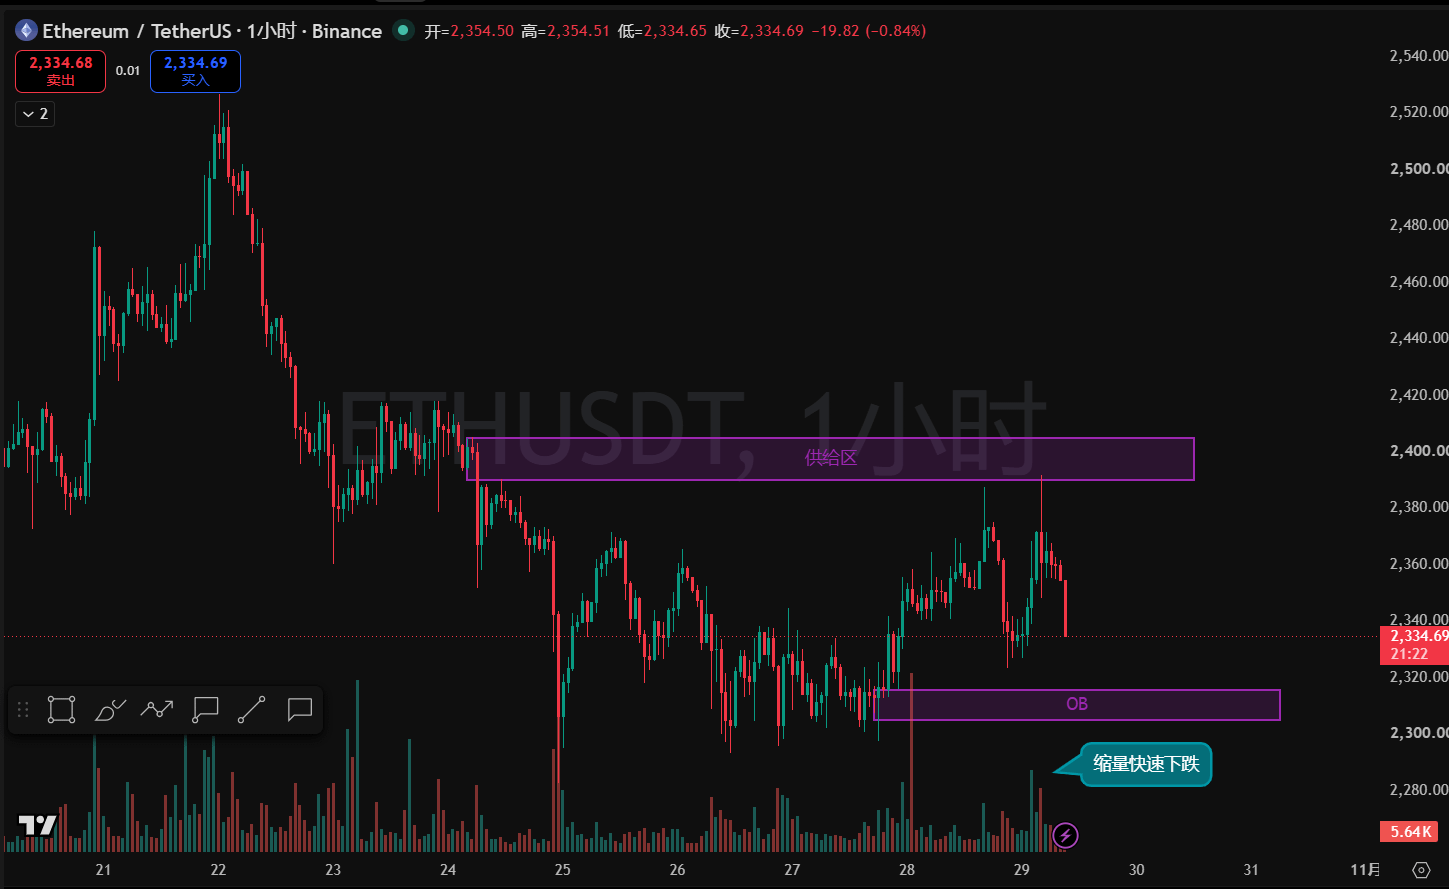
1-hour chart: Price has repeatedly formed long upper wicks at 2389, and the morning pullback was a low-volume decline. This shows that, even without supply, market sentiment remains bearish and price is probing lower quickly. For a short-term long, you could watch around 2315, then switch to the 5-minute or even 1-minute chart once price reaches that area and look for a structural reversal before entering with a small position (the position should be small because this is mostly countertrend). Today’s short-entry area is around 2361; we’ll post a reminder in the group when the time comes.