#EarningsSeason #analisis 📉📈
🔄 MULTI-TIMEFRAME EVOLUTION: From the monthly flush to the rebound, or are we seeing a false “Earnings Season” in crypto? 📊🤔
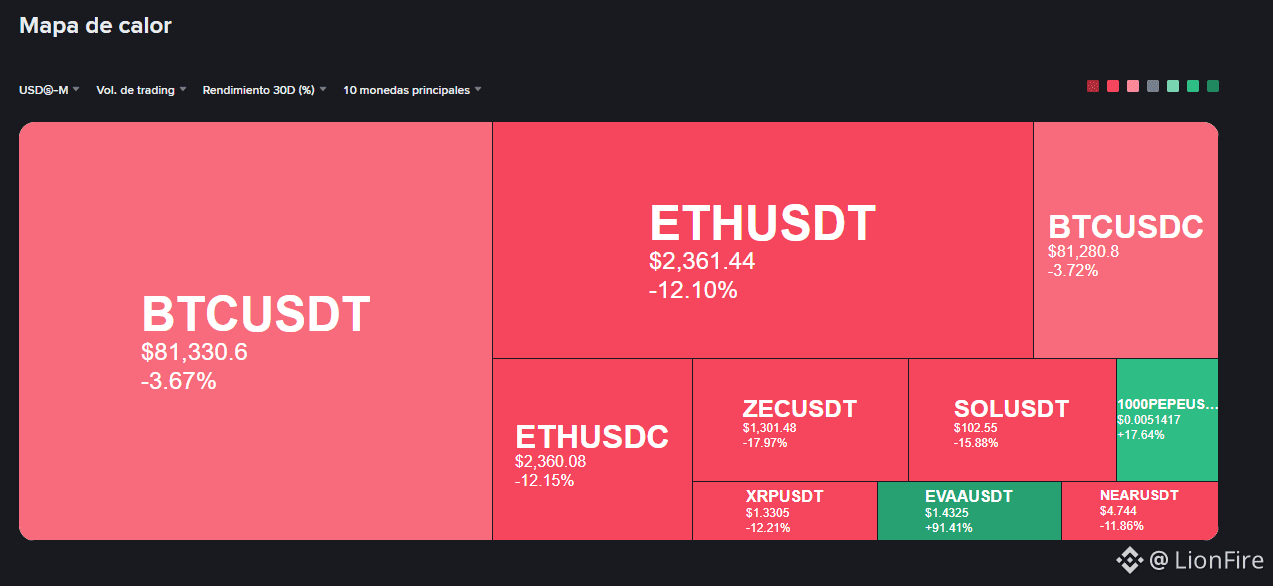
When analyzing market movements through our heat maps, the contrast between timeframes reveals a masterclass in how liquidity moves. Looking at the 30-day view, the picture has been one of a deep correction: Bitcoin is down -3.67%, Ethereum has fallen -12.10%, and Solana has accumulated widespread losses of -15.88%.
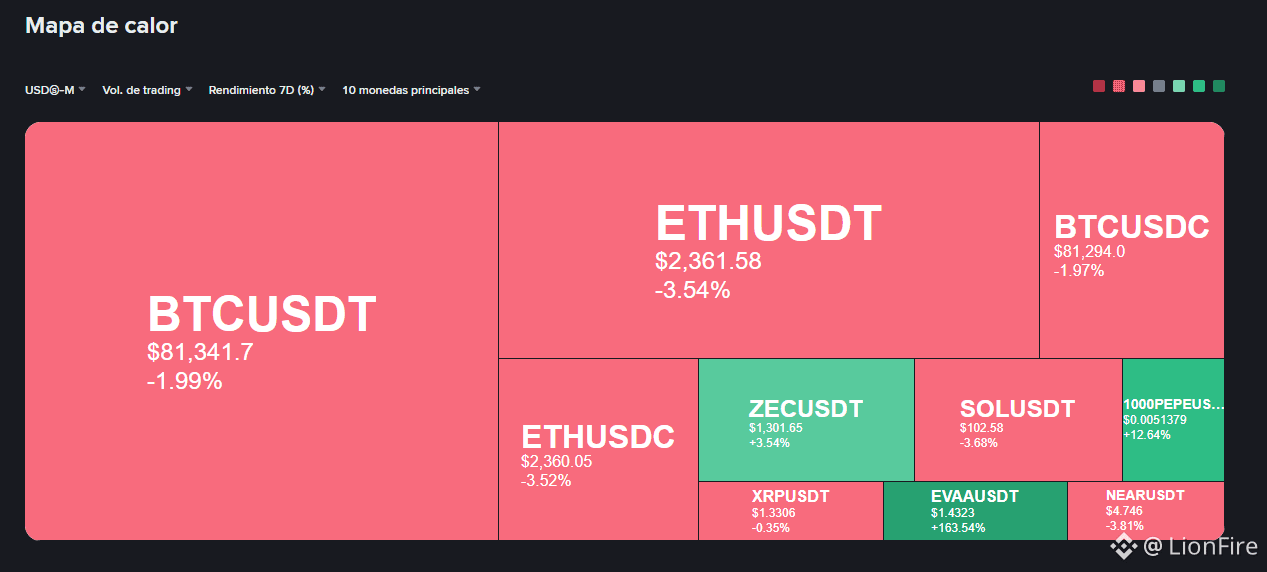
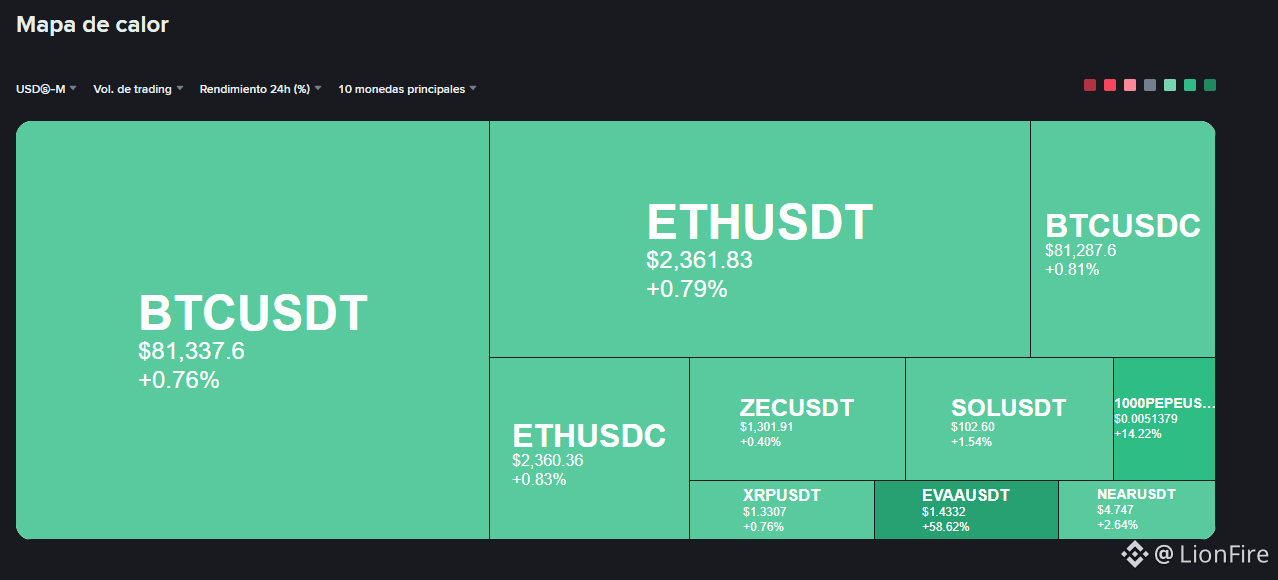
However, narrowing the lens to 7 days neutralizes the decline, and the 24-hour map paints the board green, with coordinated rebounds in major assets (BTC +0.76%, ETH +0.79%, SOL +1.54%).
🔍 The big question: Is there an “Earnings Season” in crypto?
While Wall Street measures its cycles according to quarterly corporate earnings reports, the crypto ecosystem operates under entirely different rules. There are no quarterly balance sheets or investor calls with executives here; the drivers of value are strictly capital flows, adoption narratives, and leverage flushes.
🧱 The giants digest: Major assets have spent an entire month flushing out excesses and absorbing institutional selling pressure, building stable bases after weeks of declines.
🚀 While the leaders consolidate in an orderly fashion, speculative liquidity seeks out high-asymmetry anomalies. Extreme cases like EVAA’s sustained rally (with massive weekly gains exceeding +160%) show that crypto profits don’t depend on a corporate calendar, but on spotting where hidden volume is concentrated while the rest of the market rests.
💡 The market rewards a global perspective: understanding that a monthly correction is not the end of the trend, but a rebalancing phase. Identifying the timing across timeframes is what separates the novice speculator from the strategic trader. Stay cool-headed and trade methodically! 🧠⚡