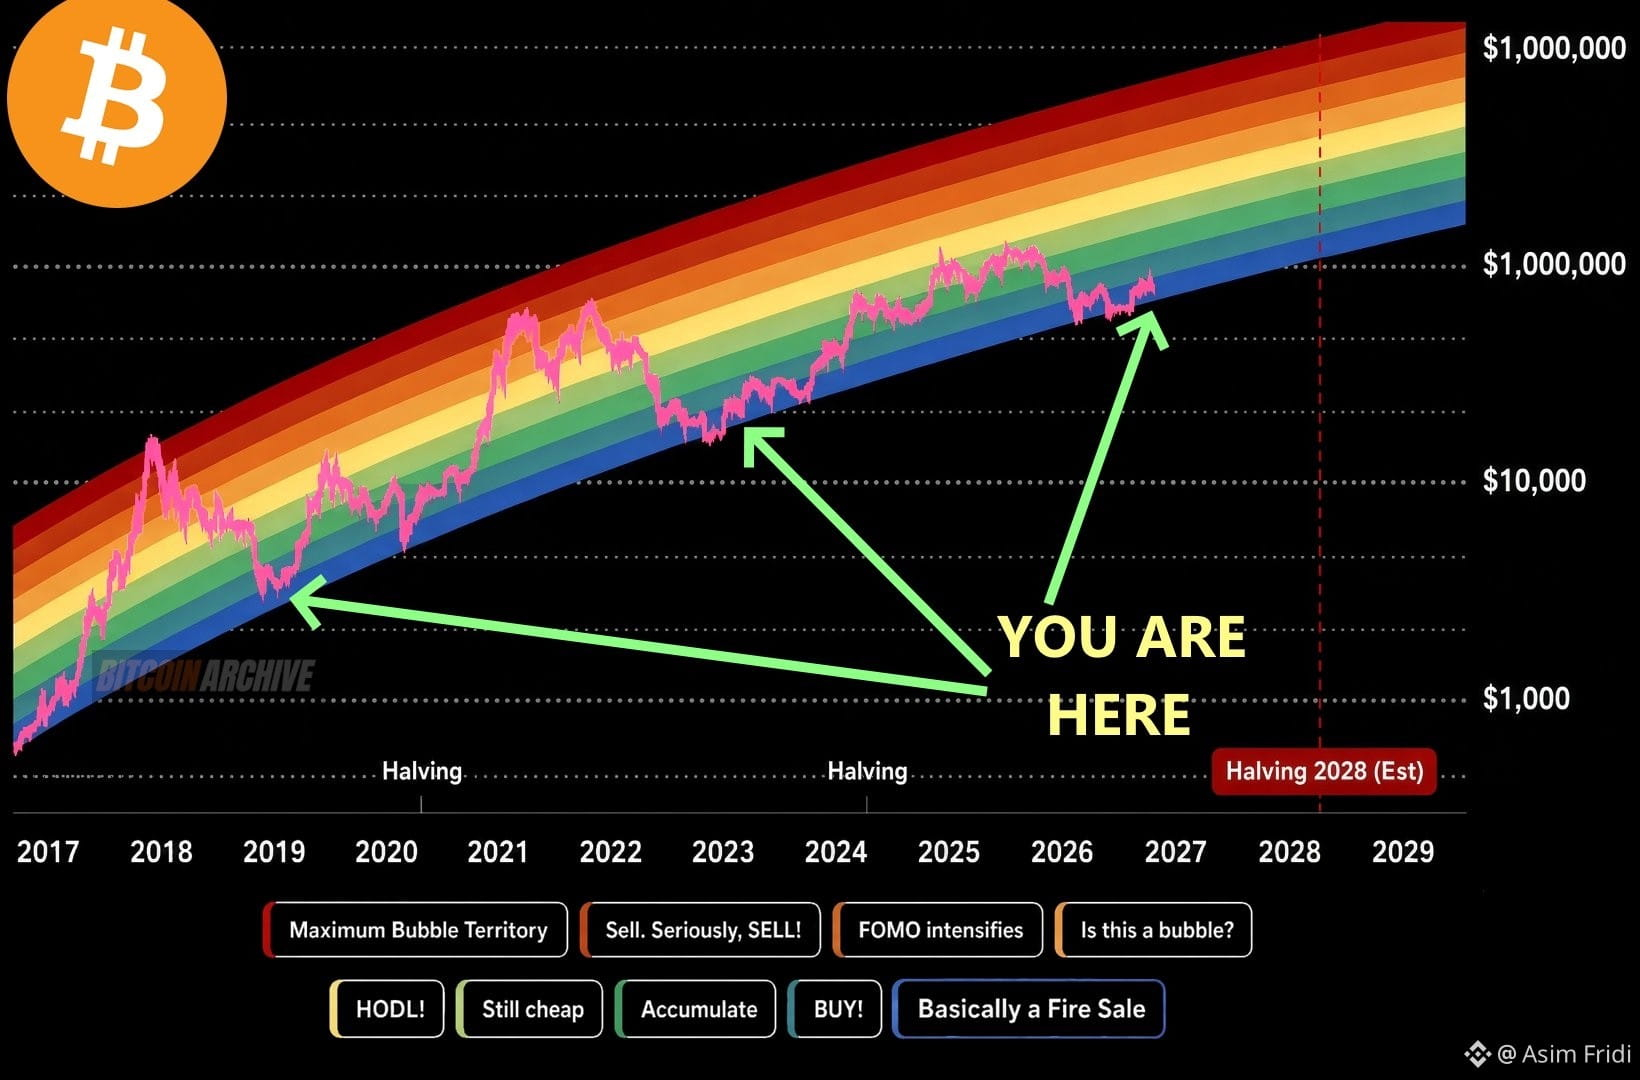
🌈 BITCOIN RAINBOW CHART: WHERE ARE WE IN THE CYCLE? ₿🚀$BTC
$XPIN
Bitcoin’s long-term Rainbow Chart gives investors a colorful way to visualize market cycles, from potential accumulation zones to extreme FOMO territory.
📊 What does the chart suggest?
🟦 Blue Zone: Potential accumulation area
🟢 Green Zone: Historically attractive price territory
🟡 Yellow Zone: Momentum and optimism may increase
🟠 Orange Zone: FOMO could start taking over
🔴 Red Zone: Extreme optimism and potential overheating
⏳ The chart marks the next Bitcoin halving around 2028, which could become an important milestone for the next market cycle.
🧠 My trading strategy:
✅ Avoid buying just because prices are pumping.
✅ Accumulate gradually instead of going all-in.
✅ Keep some capital available for market corrections.
✅ Set realistic targets and manage risk.
✅ Never rely on one chart to make financial decisions.
🔥 Remember: The Rainbow Chart is a long-term visualization tool, NOT a guaranteed Bitcoin price prediction.
📈 Are we in an accumulation phase, or is the next major bull run getting closer?
👇 Share your thoughts!
#Bitcoin #BTC #Crypto #BitcoinRainbowChart #CryptoTrading #BitcoinHalving #BinanceSquare