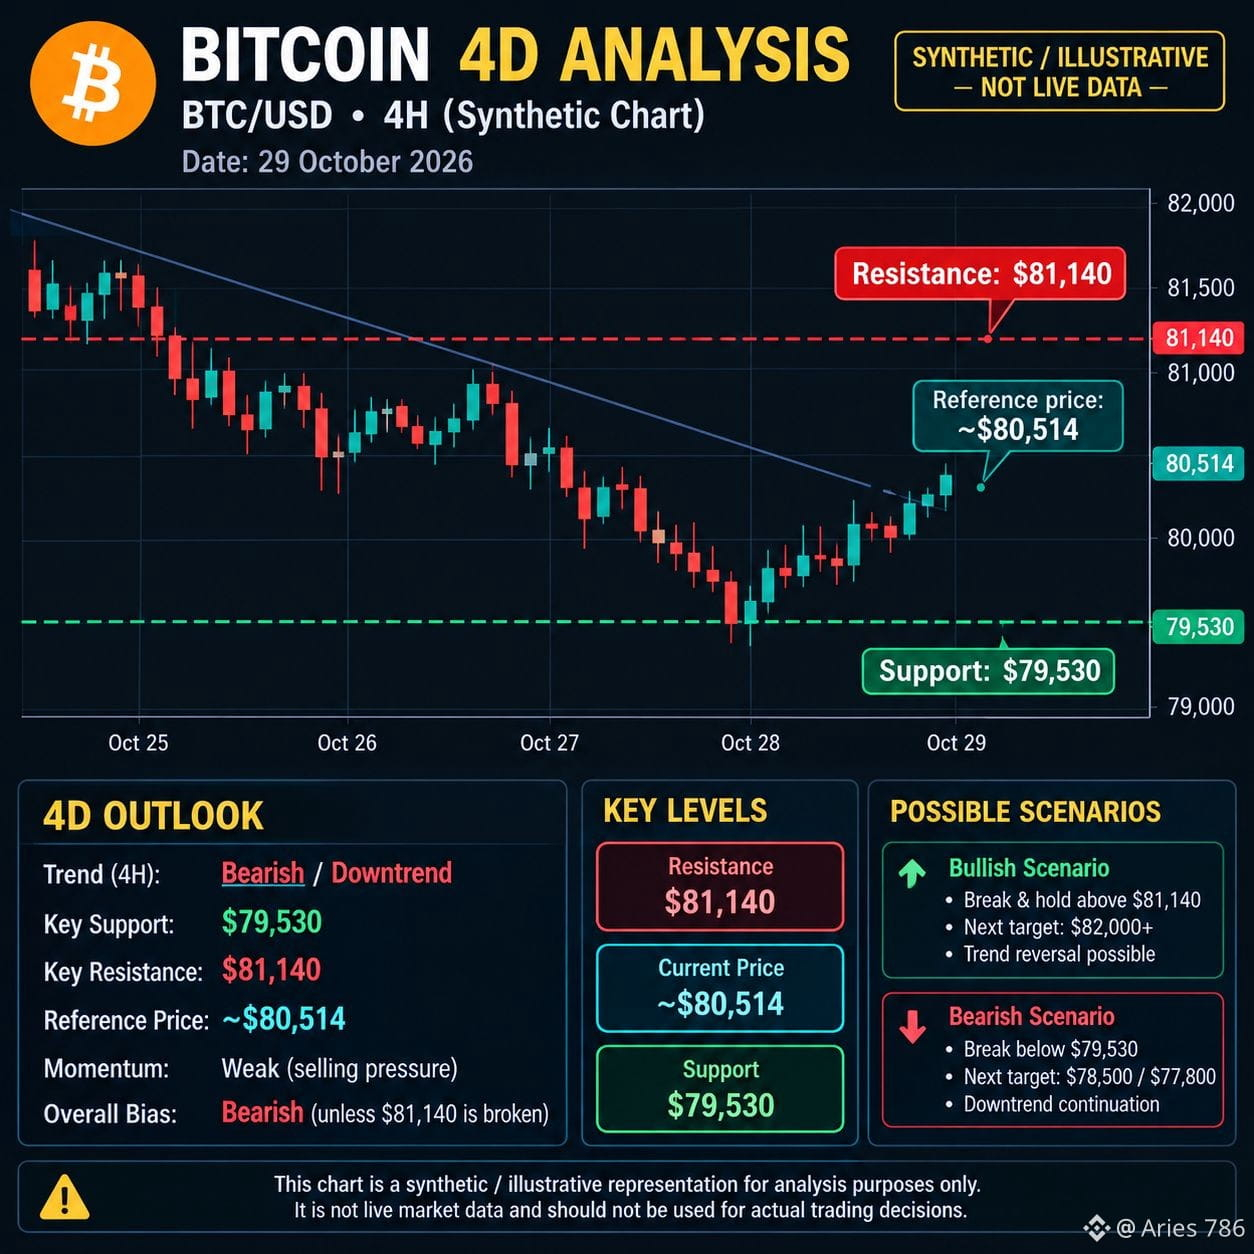
$BTC In a 4H analysis, it is important to examine the trend, support, resistance, and candle confirmation. The synthetic chart is illustrative, not a live $BTC price chart, so do not treat it as a real-time market signal.
Reference: Latest available technical levels reported for 29 October.
Trend: Short-term bearish; price is below the key pivot.
Support: Around $79,530.
Resistance: Around $81,140.
Bullish signal: A sustained 4H close above $81,140 could support a recovery.
Bearish signal: A break below $79,530 could indicate further downside.
Hashtags: #Bitcoi n #BTC #BTC🔥🔥🔥🔥🔥 #CryptoAdvenure #4HChart