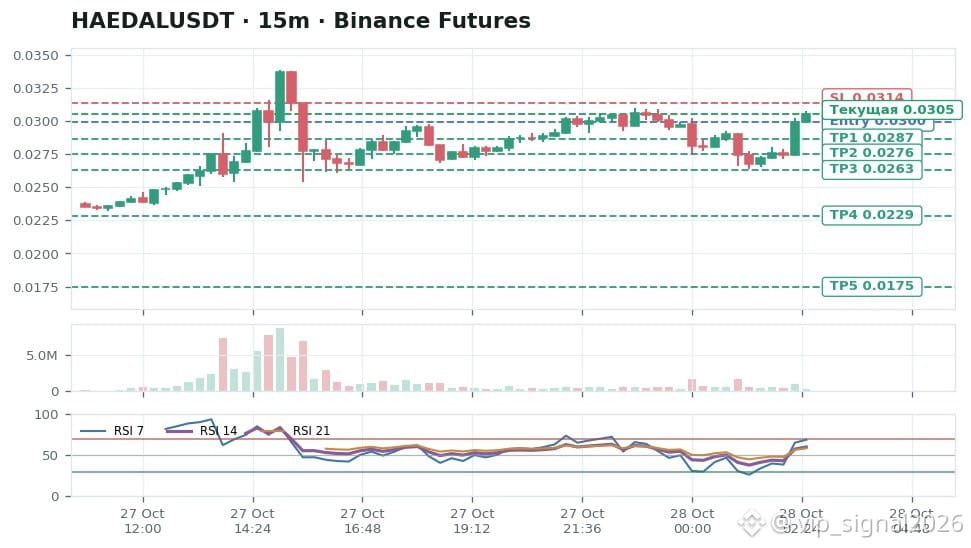
$HAEDAL SHORT
The indicator on the minute charts has climbed into extreme zones, but higher timeframes show a more restrained outlook, serving as a reminder of the importance of discipline. Comparing volume across the one-minute and thirty-minute charts highlights the difference in activity levels, but the figures do not predict the outcome. If the price moves downward, staying calm will help you cover the distance to the planned targets without rushing.
🔹Entry zone: 0.02996$
✅Take profit 1: 0.0286861$
✅Take profit 2: 0.02755123$
✅Take profit 3: 0.0263131$
✅Take profit 4: 0.02286936$
✅Take profit 5: 0.01747949$
❌Stop-loss: 0.03139808$
📈 RSI14: m1 83.1 • m5 69.0 • m15 60.4 • m30 60.1
📊 VOL: m1 $290.9K • m5 $307.6K • m15 $307.1K • m30 $307.1K
🧲 OI: now $5.3M • 5m -1.0% • 15m -0.6% • 30m +3.8%
⚠️ This is not financial advice. Trade at your own risk. DYOR.
#HAEDAL #Signal #Trade 📈
$HAEDAL