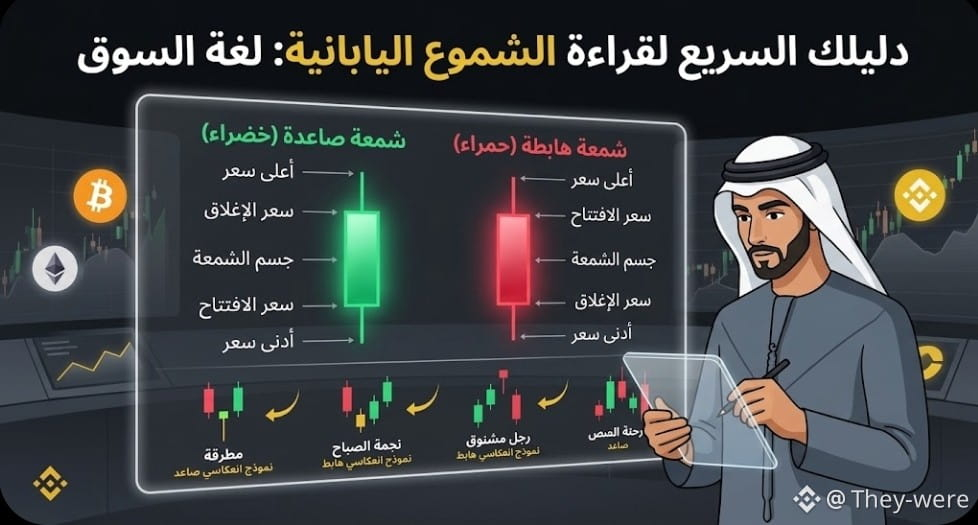
Have you ever looked at a trading chart and felt like you were staring at indecipherable symbols? The secret lies in reading Japanese candlesticks (Candlesticks)—the alphabet of trading that reveals the battle between buyers and sellers every second! ⚡
Each candle tells you four essential things about the price over a specific period of time:
Opening price (Open)
Closing price (Close)
The highest price reached (High)
The lowest price reached (Low)
💡 Quick tips to understand them:
🟢 Green candle (bullish): Indicates buyers are in control, as the closing price is higher than the opening price.
🔴 Red candle (bearish): Indicates sellers are in control, as the closing price is lower than the opening price.
📌 Shadows/Wicks: Show the full range reached by the price and often indicate price rejection or a fierce battle between the two sides at support and resistance levels.
Learning to read candlesticks gives you the ability to anticipate price reversals and make precise entry and exit decisions instead of trading randomly!
💬 Question for the community: Which candlestick reversal pattern do you always rely on in your trades? Share your experience in the comments!
$GOOGLB #Japanese_Candlesticks #Technical_Analysis #Cryptocurrency_Trading #Learn_Trading #استراتيجية_التداول
#CandlestickPatterns #TechnicalAnalysis #CryptoTrading #TradingEducation #CryptoInvesting #PriceAction #BinanceSquare #CryptoArab #CryptoCommunity #Bitcoin #Ethereum #TradingTips #SmartTrading #CryptoMarket
Each candle tells you four essential things about the price over a specific period of time:
Opening price (Open)
Closing price (Close)
The highest price reached (High)
The lowest price reached (Low)
💡 Quick tips to understand them:
🟢 Green candle (bullish): Indicates buyers are in control, as the closing price is higher than the opening price.
🔴 Red candle (bearish): Indicates sellers are in control, as the closing price is lower than the opening price.
📌 Shadows/Wicks: Show the full range reached by the price and often indicate price rejection or a fierce battle between the two sides at support and resistance levels.
Learning to read candlesticks gives you the ability to anticipate price reversals and make precise entry and exit decisions instead of trading randomly!
💬 Question for the community: Which candlestick reversal pattern do you always rely on in your trades? Share your experience in the comments!
$GOOGLB #Japanese_Candlesticks #Technical_Analysis #Cryptocurrency_Trading #Learn_Trading #استراتيجية_التداول
#CandlestickPatterns #TechnicalAnalysis #CryptoTrading #TradingEducation #CryptoInvesting #PriceAction #BinanceSquare #CryptoArab #CryptoCommunity #Bitcoin #Ethereum #TradingTips #SmartTrading #CryptoMarket