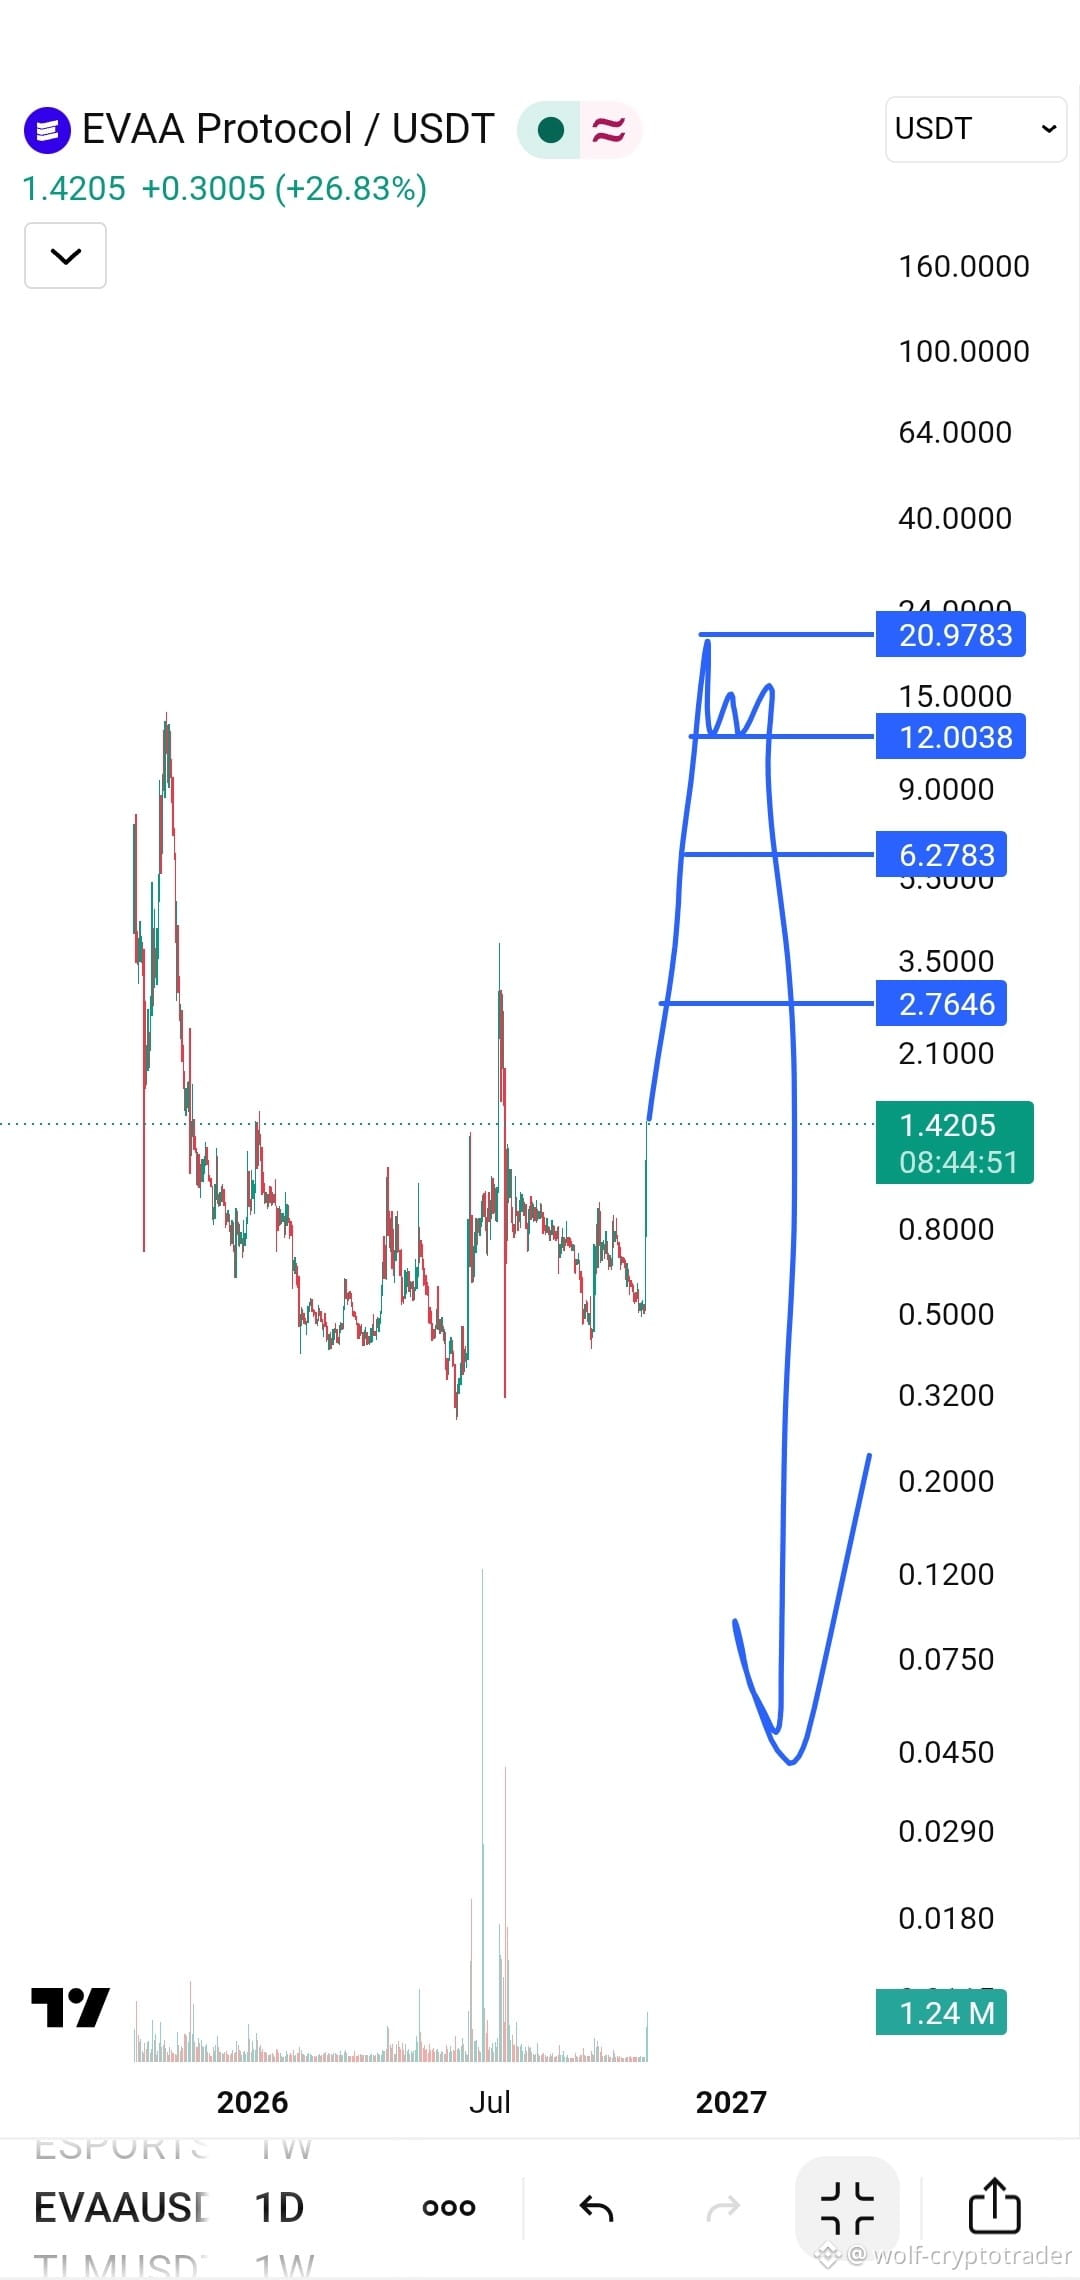
In the world of trading, sometimes a chart gives you a complete map of the future. You don’t need news; you need to read the technical scenario clearly. Take a look at the current EVAA Protocol chart. We’re looking at a striking example of a complete “life cycle”: a rocket-like rise, followed by a freefall
📊 Part One: The Journey to the Peak
The coin has woken from its slumber. The blue arrow shows a gradual, staircase-like path toward historic levels we haven’t seen in a while. Technical levels to watch
📊 Part One: The Journey to the Peak
The coin has woken from its slumber. The blue arrow shows a gradual, staircase-like path toward historic levels we haven’t seen in a while. Technical levels to watch