

@
25 days ago, when we shared an analysis post
Zero Statement
And we laid out its precise details. These numbers meant nothing on the chart, and this scenario had no meaning.
Today, 25 days later, do you think it was a roadmap for building the structure down to its finest details?
Zero Statement | 25 days ago, we mapped out the possibilities… and today we’re watching the scene whose details we warned about!
On 4/10, we didn’t pull numbers out of thin air or merely predict Bitcoin’s direction. We laid out a complete map of the key thresholds and decision points, identifying how the correction could end, how it could continue, and what conditions would be needed to rebuild the bullish structure.
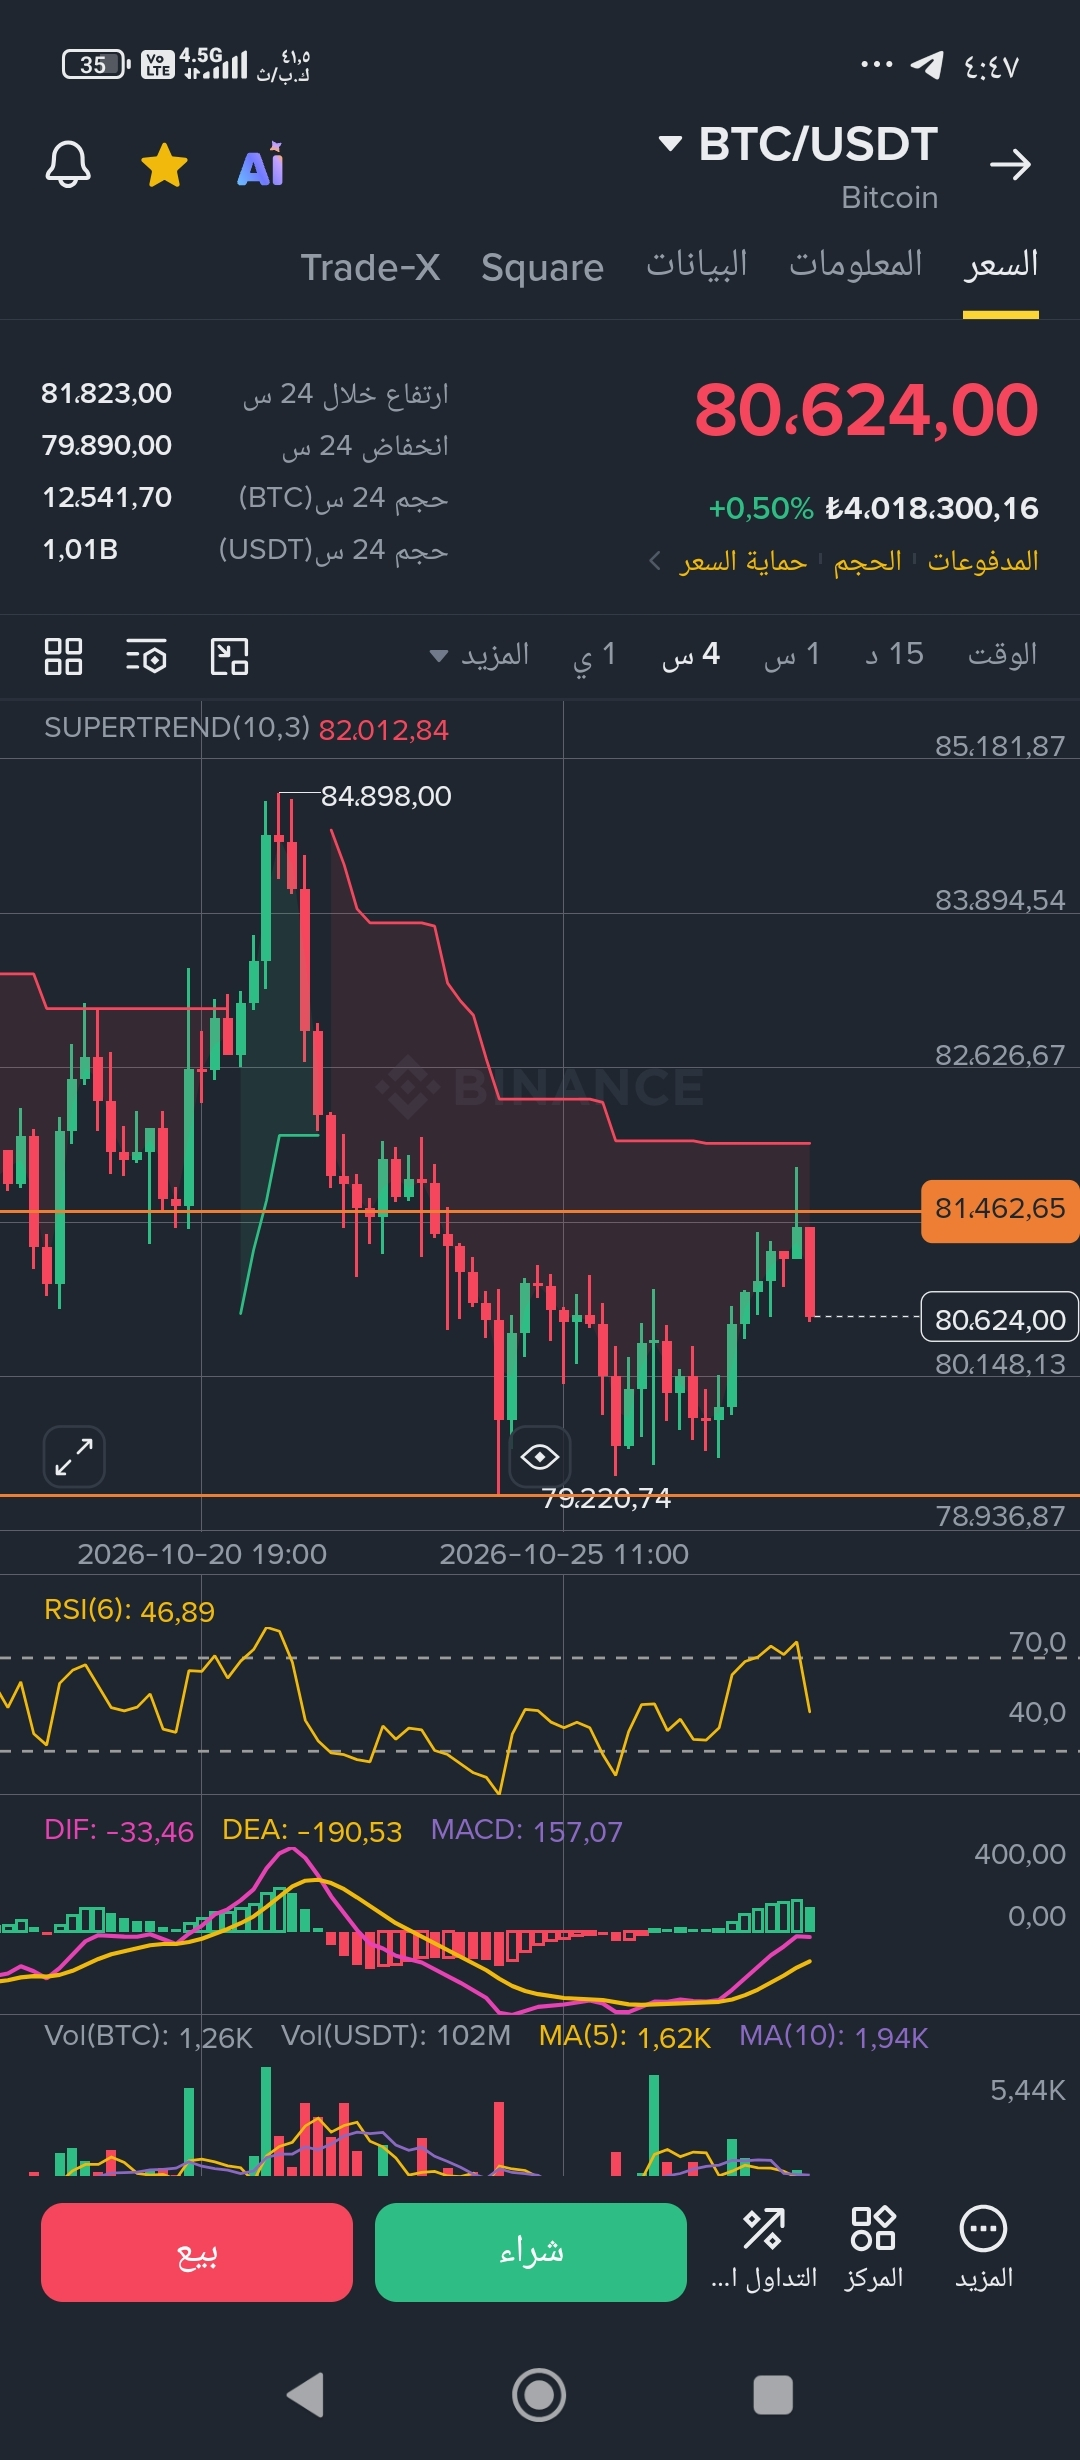
Today, we’re placing the live chart alongside what we published—not to claim that the scenario has played out, but to show where the price stands in relation to the map we drew earlier.
First | The bullish scenario and the conditions for its continuation
We identified the 84,760–84,473 zone and stipulated that the liquidity candle must not extend to or break below 82,775, as that could distort the structure of the uptrend and require us to reassess it.
Second | If the correction continues, these are the key thresholds and decision points
We identified 80,844 as a potential liquidity sweep zone, and 80,126 as a red line for reassessing the model on lower timeframes.
We then stipulated that a swing low should form near 79,458 without breaking below 78,580, followed by a confirmation candle for the uptrend that reclaims 81,478 and restores closes above it.
Third | Where does the price stand now?
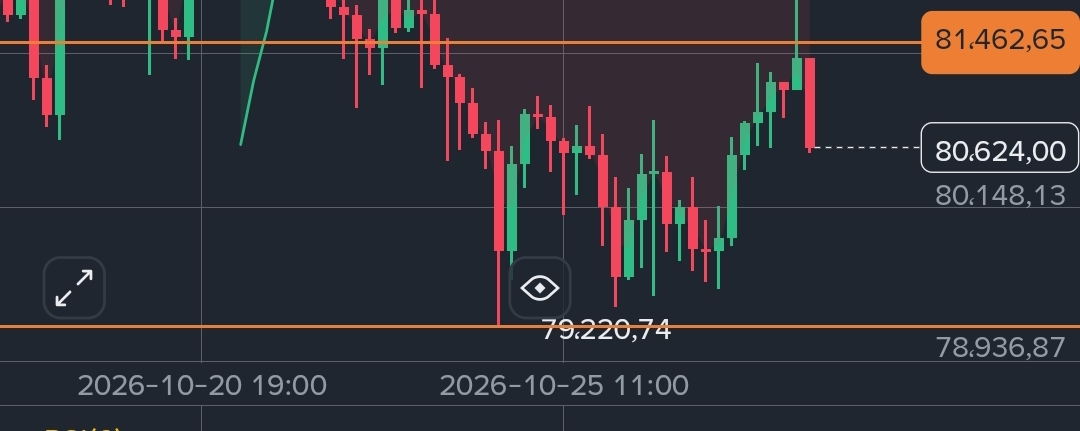
Here’s the chart: the price is trading near 80,624 and has recorded a low of 79,220.74. In other words, it fell below 79,458 but did not reach the 78,580 level specified in the scenario. It also approached 81,478 but did not reclaim it; the highest level shown on the chart was 81,462.65 before the pullback.
These details are at the heart of the analysis: we don’t declare the pattern complete just because a bounce has appeared, nor do we judge it to have failed before the invalidation conditions are met. We’re watching how the price resolves the next levels, and whether it can confirm a reversal or force us to rebuild the structure from scratch.
With the Fed’s upcoming decision, along with the weekly and monthly closes and the three-day candle, we’re entering a phase that warrants close attention. The difference between the scenarios won’t be determined by predictions, but by what price action actually confirms.
Twenty-five days ago, we published the levels and conditions. Today, we’re putting them in front of you for comparison and verification—not to exaggerate or claim that every scenario has played out.
Praise be to God, before and after; we have no knowledge except what You have taught us. This is an effort to interpret the technical picture based on our model and experience, not a financial recommendation.
Do you think the current move is nearing completion of the structure we mapped out, or will the conditions require us to rebuild the model? Your views and assessments matter to me as we decide whether to continue or adjust the course of this approach.
And God knows best.
Wishing everyone success.