
**“The Week On-Chain” summary – Glassnode (October 28, 2026)**
**Summary:** Bitcoin is stuck below the $84,000–$85,000 range. The market is quiet, demand is weak, but selling is also light. Everyone is awaiting the Fed’s decision today.
**Key takeaways:**
- **ETFs:** Most of the October 19 inflows have exited ($653 million), including $540 million on October 22. Net flows over the past two weeks totaled just $67 million, and trading volumes have been low since May.
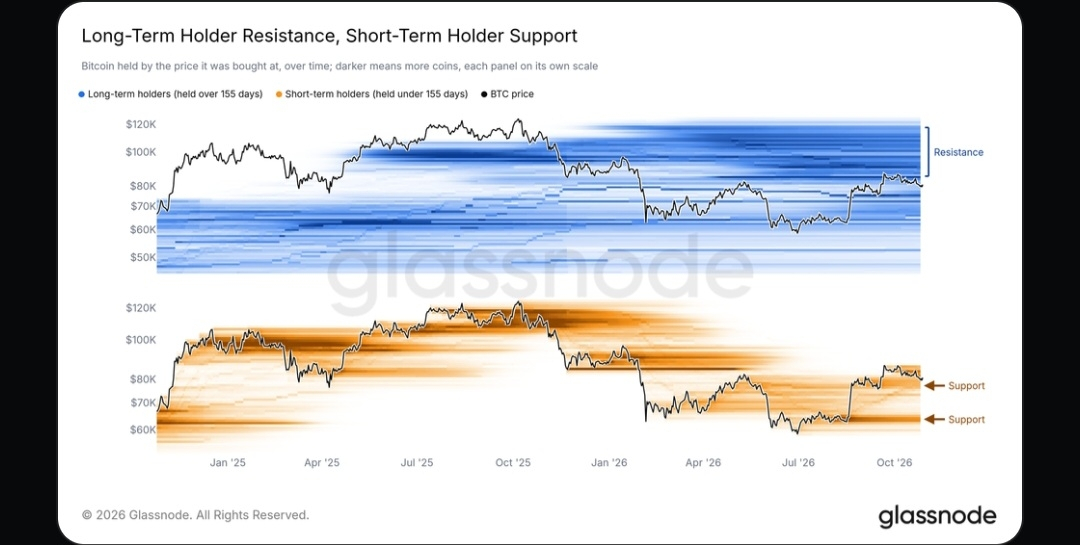
- **Resistance and support (Figure 1):** Long-term holders own around 4 million BTC bought between $85,000 and $118,000, and may sell if the price returns to $85,000 to recoup their losses. Short-term holders have a cost basis mostly near $77,000, with a second cluster near $64,000; these are two support levels.
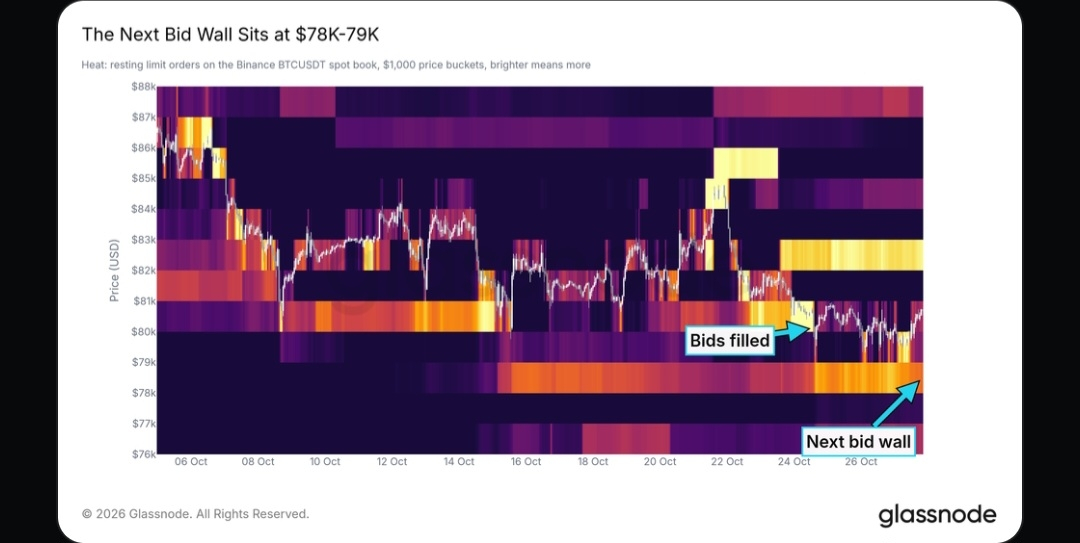
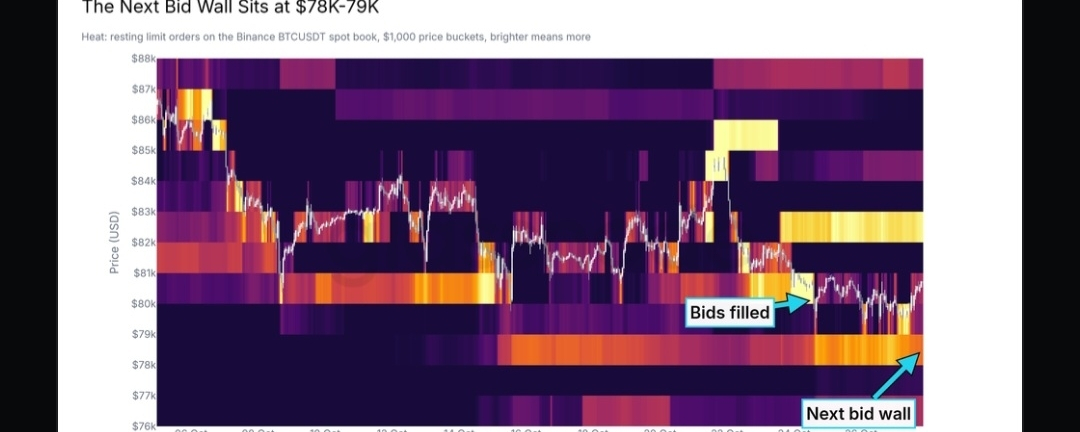
- **Order-book wall (Figure 2):** Buy orders at $80,000 have disappeared (just $3.4 million remains). The largest wall has shifted to $78,000–$79,000, at around $42 million—the first level where buyers are expected to step in.
- **$84,000–$85,000 range:** The price has been rejected four times this year and has closed above this range on only five days. For it to become support, the price needs to close above $85,000 on consecutive days.
- **Cost levels:** The price is below the ETF average cost basis ($81,500). Below that is the true market mean ($77,900), followed by the short-term holder cost basis ($75,800).
- **Macro:** The leading economic indicator is stalled, and U.S. consumer confidence is at 48.1, near its lowest level since 2009. The Fed raised rates by 0.25% on September 16, and any further increase would put pressure on risk assets.
- **2023 comparison:** The current rally followed the 2023 trajectory for three months before falling behind (+38% from the bottom versus +75%). However, a broader range of wallet cohorts is buying now, especially wallets holding 100–1,000 BTC.
- **Volatility:** It has returned to summer 2023 levels (around 25%). Bitcoin has been less volatile than this on only 5% of days since 2015. Such calm often precedes a sharp move.
- **Realized losses:** They are shrinking with each downturn (from $630 million in August to $27 million on October 24), indicating that selling at a loss is declining.
- **Hyperliquid:** Trading in stocks, indices, and commodities ($2.6 billion daily) has surpassed Bitcoin futures trading ($2.4 billion).
- **Altcoins:** The share of the top 100 coins trading above their 200-day average has fallen from 88% to 66%, indicating weaker risk appetite.
**What to watch:**
- **Upside:** Daily closes above $85,000 and a return of ETF inflows with increasing volumes.
- **Downside:** A daily close below $77,900; the next support is $75,800.