📊 Quick technical analysis of $TWT
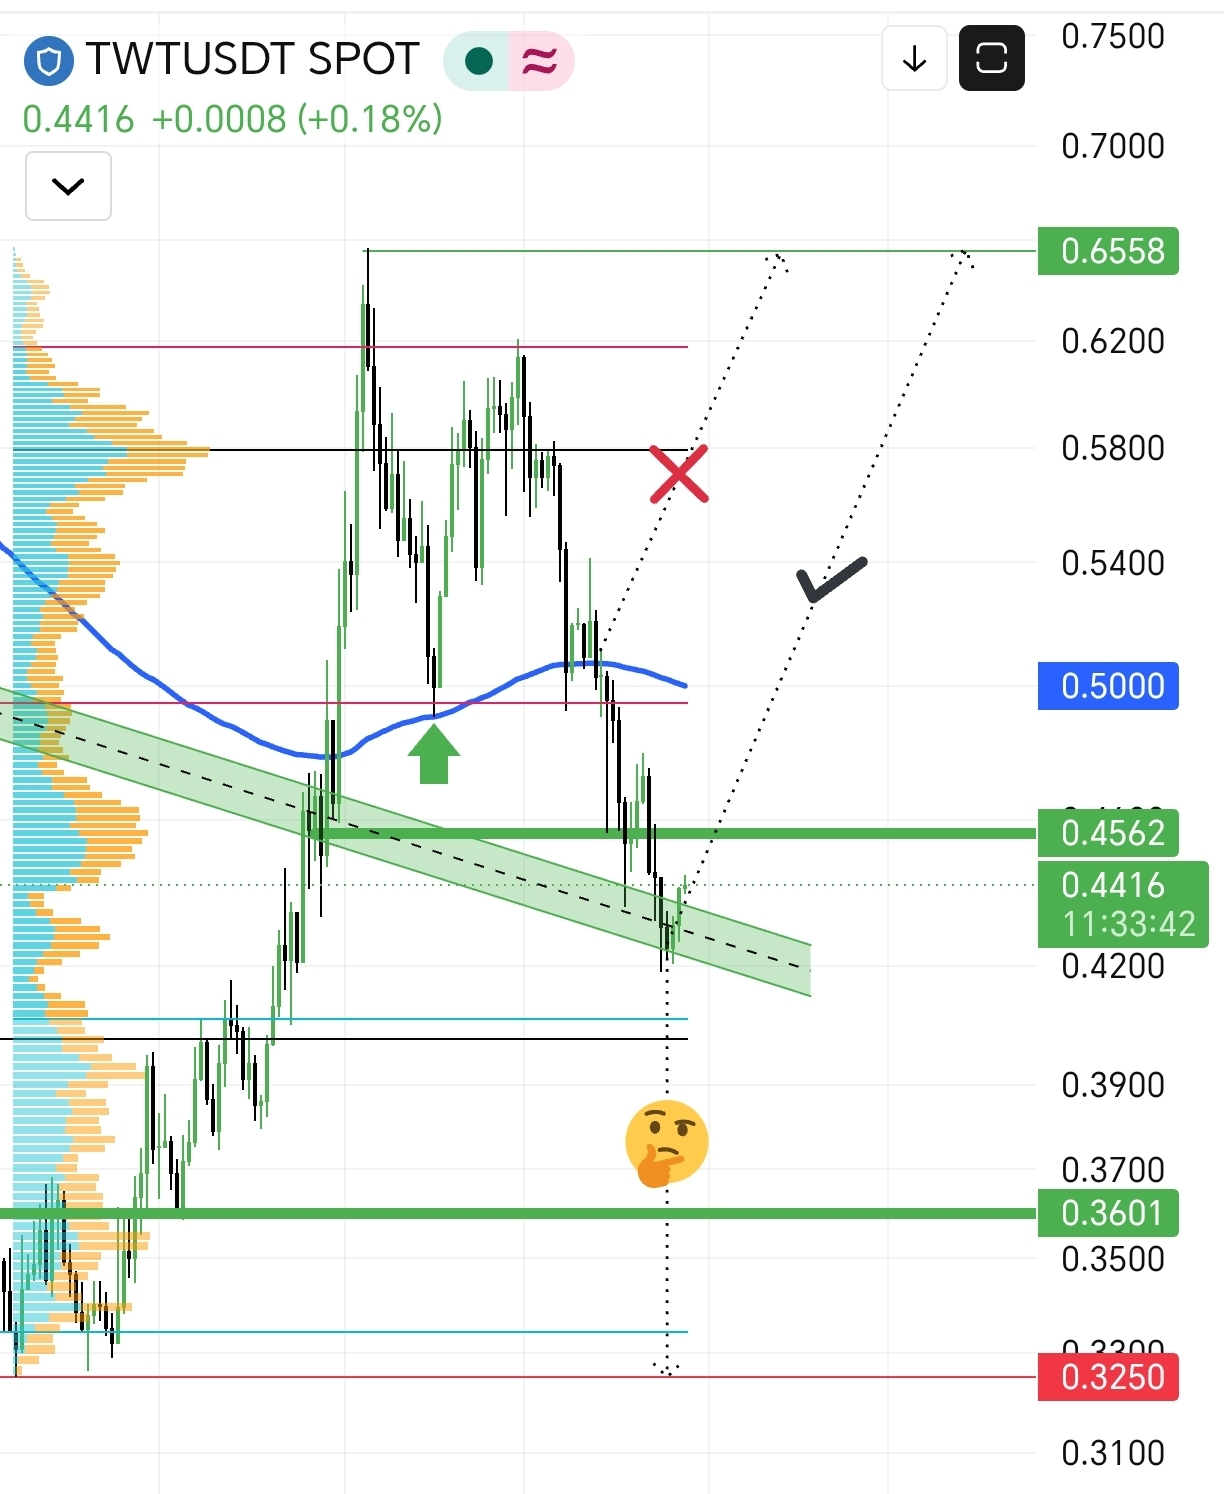
The current price is trading around $0.4416, while testing a critical area and the boundaries of a minor price channel.
Current pivot zone: The price is currently testing a descending support range within the channel shown (the green area). This level may offer an opportunity for a temporary corrective rebound if it holds.
Moving averages: The price is below the main moving average (the blue line, at around $0.5000), reflecting previous selling pressure and attempts to break above the trend line.
Possible scenarios:
📈 Positive rebound scenario: If the price manages to hold the current support and break above $0.4562, we could target a return toward resistance near $0.5000.
📉 Continued decline scenario: A break below the current support could push the price toward lower liquidity levels, with historical support at $0.3601.
Note: Please monitor the current candle's close and manage risk carefully.
The current price is trading around $0.4416, while testing a critical area and the boundaries of a minor price channel.
Current pivot zone: The price is currently testing a descending support range within the channel shown (the green area). This level may offer an opportunity for a temporary corrective rebound if it holds.
Moving averages: The price is below the main moving average (the blue line, at around $0.5000), reflecting previous selling pressure and attempts to break above the trend line.
Possible scenarios:
📈 Positive rebound scenario: If the price manages to hold the current support and break above $0.4562, we could target a return toward resistance near $0.5000.
📉 Continued decline scenario: A break below the current support could push the price toward lower liquidity levels, with historical support at $0.3601.
Note: Please monitor the current candle's close and manage risk carefully.