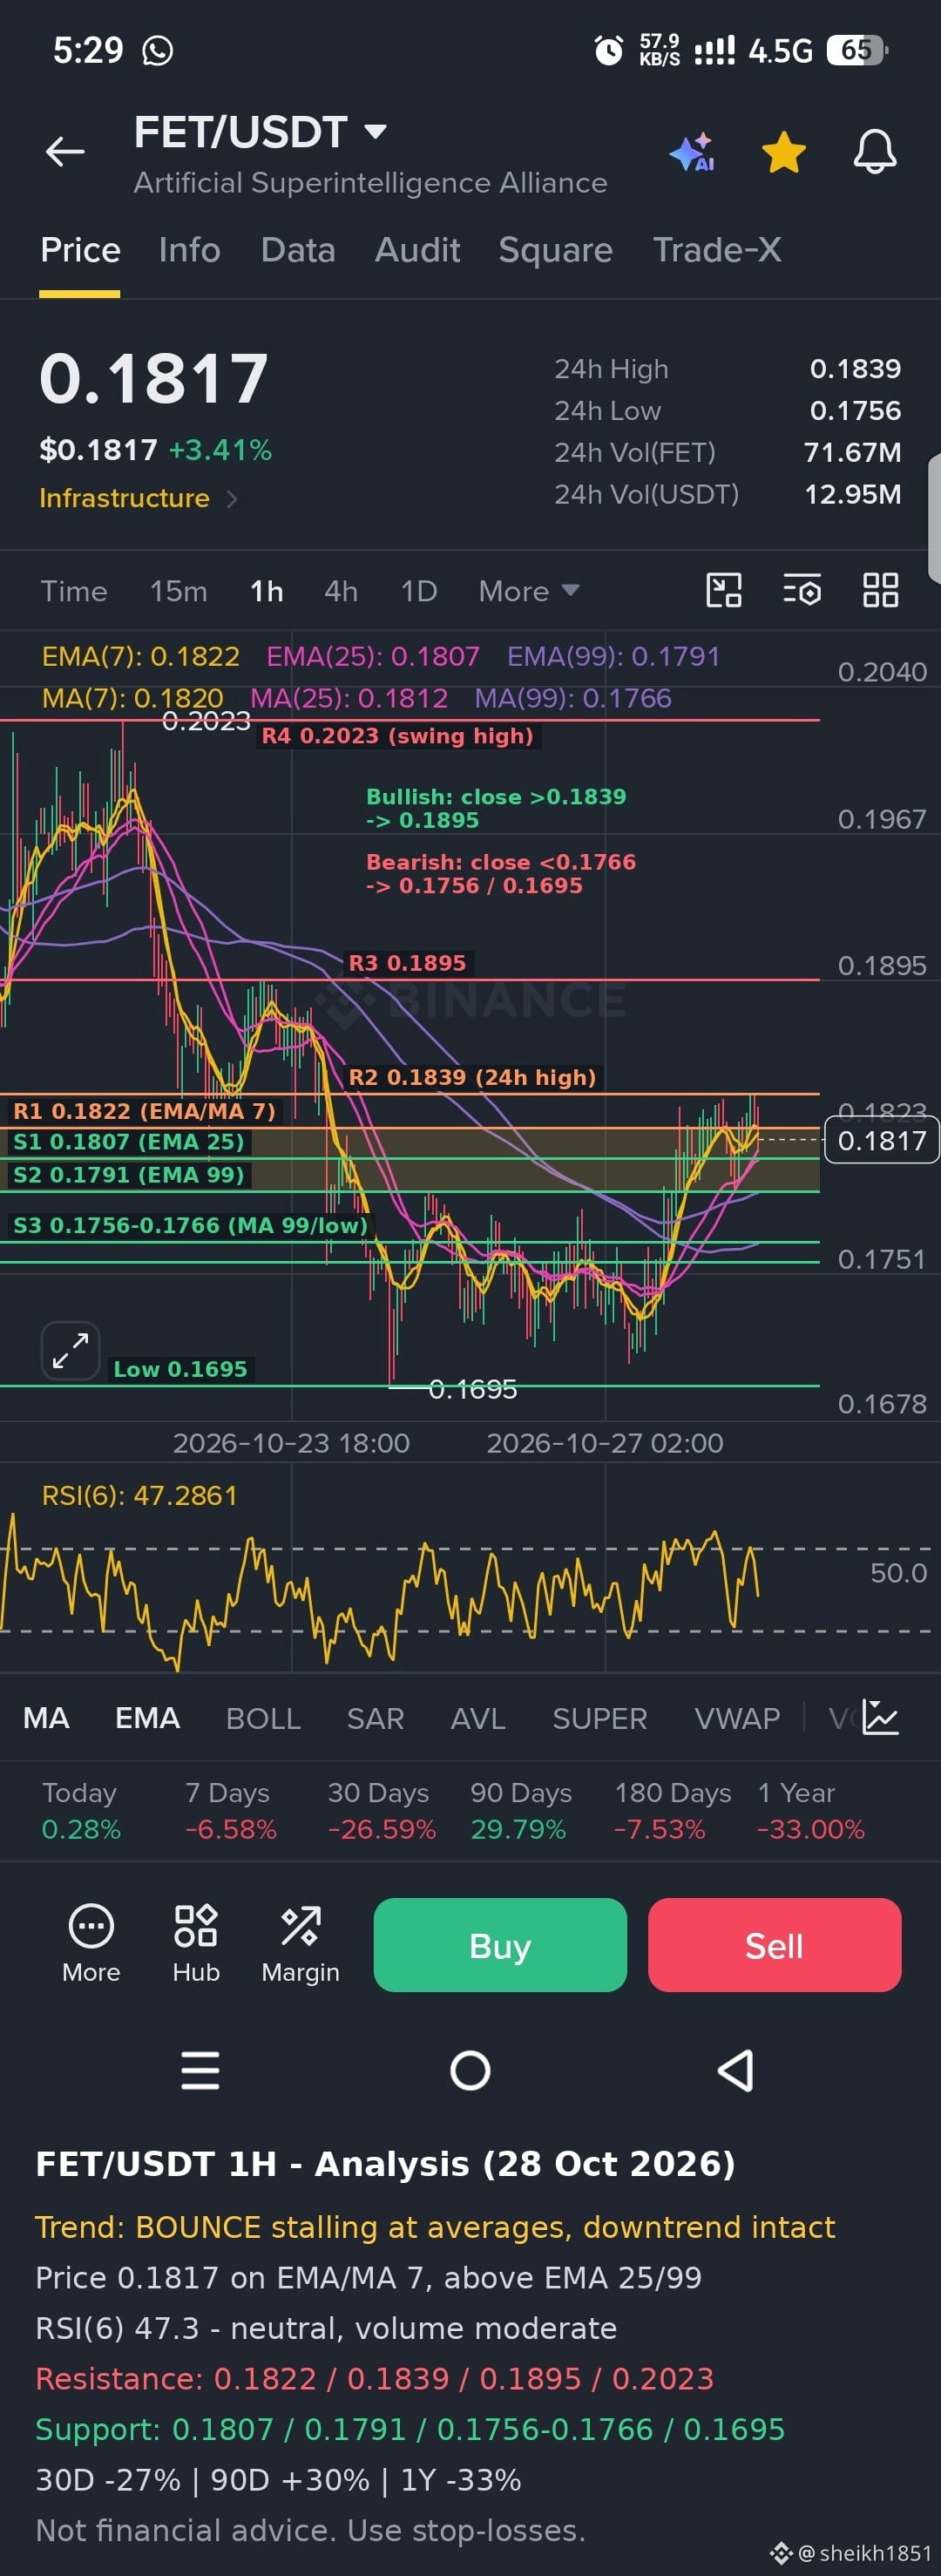
$FET FET/USDT (1H) – Quick Analysis
Trend: A recovery bounce inside a larger downtrend, now stalling at the averages. After bottoming at 0.1695, price made a higher low near 0.175 and rallied to 0.1817. It is sitting right on the short-term averages: just below EMA(7) 0.1822 and MA(7) 0.1820, and just above EMA(25) 0.1807 and EMA(99) 0.1791. The larger picture is still weak: the coin is down about 27% over 30 days, about 7% over 7 days and about 33% over one year, though up about 30% over 90 days. It remains far below the 0.2023 swing high.
Momentum: RSI(6) is about 47.3, which is neutral. After the sharp bounce, buying pressure has cooled and the averages are bunched together, which points to consolidation. Volume is moderate (about 12.95M USDT).
Key levels:
Resistance: 0.1822 to 0.1823 (EMA/MA 7), then 0.1839 (24h high), then 0.1895 and the 0.2023 swing high.
Support: 0.1807 to 0.1812 (EMA/MA 25), then 0.1791 (EMA 99), then 0.1766 (MA 99) and 0.1756 (24h low). Below that, 0.1695 is the key low.
Outlook: Price is at a decision point. A 1H close above 0.1839 with rising volume would confirm the bounce and open 0.1895. Holding above 0.1791 keeps the higher-low structure intact. A close below 0.1766 would suggest the bounce has failed and put 0.1756, then 0.1695, back in play. Until one side breaks, expect choppy trading between 0.179 and 0.184.
This is a technical read not financial advice. Use stop-losses and keep position sizes small.
#EarningsSeason #FOMCWatch
Trend: A recovery bounce inside a larger downtrend, now stalling at the averages. After bottoming at 0.1695, price made a higher low near 0.175 and rallied to 0.1817. It is sitting right on the short-term averages: just below EMA(7) 0.1822 and MA(7) 0.1820, and just above EMA(25) 0.1807 and EMA(99) 0.1791. The larger picture is still weak: the coin is down about 27% over 30 days, about 7% over 7 days and about 33% over one year, though up about 30% over 90 days. It remains far below the 0.2023 swing high.
Momentum: RSI(6) is about 47.3, which is neutral. After the sharp bounce, buying pressure has cooled and the averages are bunched together, which points to consolidation. Volume is moderate (about 12.95M USDT).
Key levels:
Resistance: 0.1822 to 0.1823 (EMA/MA 7), then 0.1839 (24h high), then 0.1895 and the 0.2023 swing high.
Support: 0.1807 to 0.1812 (EMA/MA 25), then 0.1791 (EMA 99), then 0.1766 (MA 99) and 0.1756 (24h low). Below that, 0.1695 is the key low.
Outlook: Price is at a decision point. A 1H close above 0.1839 with rising volume would confirm the bounce and open 0.1895. Holding above 0.1791 keeps the higher-low structure intact. A close below 0.1766 would suggest the bounce has failed and put 0.1756, then 0.1695, back in play. Until one side breaks, expect choppy trading between 0.179 and 0.184.
This is a technical read not financial advice. Use stop-losses and keep position sizes small.
#EarningsSeason #FOMCWatch