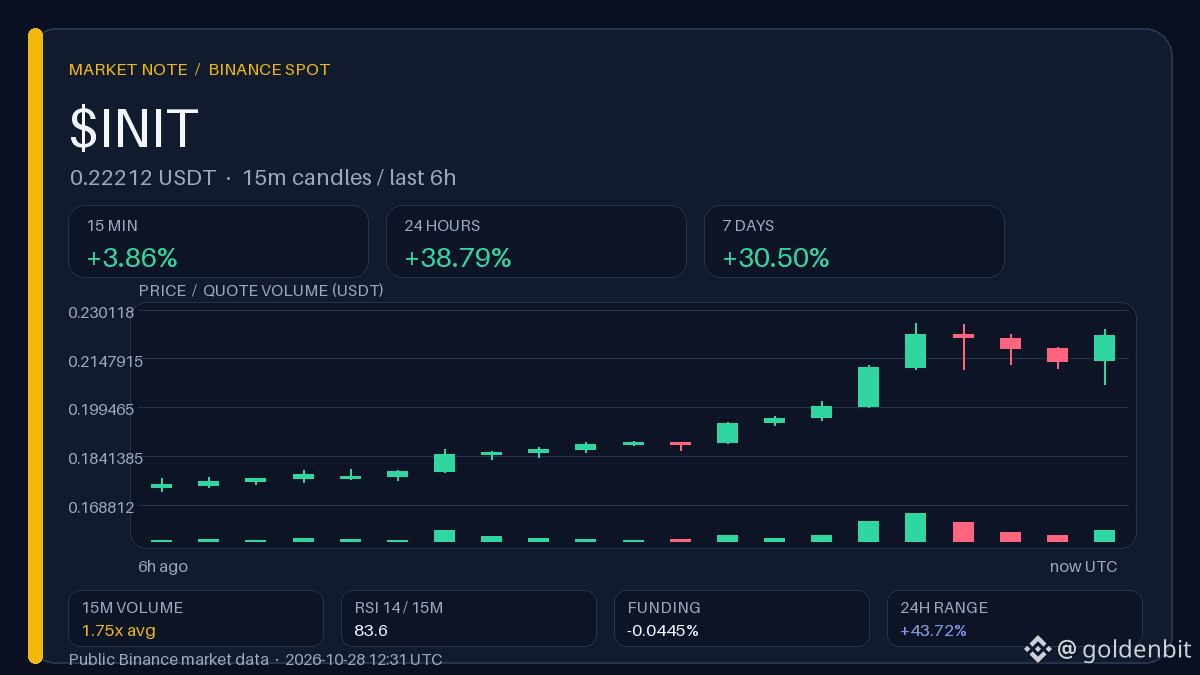
$INIT Near the top of the range, but shorts are paying funding
The price rose 38.79% in 24 hours with negative funding—the positioning imbalance may be in shorts rather than longs, but this is only a hypothesis. Funding is −0.0445% amid a 38.79% rise in 24 hours and a 30.5% rise over the week: the price is already above the weekly high of 0.1987.
Range map · 15m, last 5h
Upper boundary: 0.225890. A close above the upper boundary on elevated volume would support the hypothesis of short pressure; a lone wick without volume would weaken it.
Lower boundary: 0.173040. Weekly low: 0.113370. A move back inside the range would show that the momentum failed to hold, in which case negative funding could be read differently—as caution rather than an imbalance.
How to read this: The price is near the upper part of the range. A candle close beyond the boundary shows that the price has held there; a single wick is only a brief move beyond it. Compare volume with its usual level to assess the strength of the move.
These are historical structure levels for educational purposes, not entry points, trade targets, or trading advice.
↩️ Previous “Contrast Radar” update recap (28.10 00:17 UTC): ZEC 1,303.13 → 1,296.20 USDT (−0.53% over 12h), funding 0.000% → +0.005%.
If the price holds the upper boundary, will funding start moving toward zero, or will it remain negative?
Data from Binance, snapshot at 12:31 UTC. The author may receive rewards through Binance Square Write to Earn.