

ANiii Trader_阿尼交易员
3.6k Posts

ANiii Trader_阿尼交易员
Report
Block User
Crypto & Blockchain Insights | Web 3 Researcher & Content Creator | Market Analysis | Trading Signal Provider.X. ANiiiofficially
491 Following
4.7K+ Followers
1.8K+ Liked
Posts
All
Quotes
Live
PINNED
🧧🎁 Your Red Pocket Surprise Is Waiting! 💛
Who’s ready to grab some crypto rewards? 👀🔥
❤️ Like this post
💬 Comment “I M”
🚀 Join the fun and spread the excitement!
Don’t just scroll past—participate and try your luck! 🍀💰
#Binance #RedPocket #GIVEAWAY #CryptoCommunity
$Q
{future}(QUSDT)
🧧🎁 Your Red Pocket Surprise Is Waiting! 💛
Who’s ready to grab some crypto rewards? 👀🔥
❤️ Like this post
💬 Comment “I M”
🚀 Join the fun and spread the excitement!
Don’t just scroll past—participate and try your luck! 🍀💰
#Binance #RedPocket #GIVEAWAY #CryptoCommunity
$Q
Who’s ready to grab some crypto rewards? 👀🔥
❤️ Like this post
💬 Comment “I M”
🚀 Join the fun and spread the excitement!
Don’t just scroll past—participate and try your luck! 🍀💰
#Binance #RedPocket #GIVEAWAY #CryptoCommunity
$Q

1k
35
64
1k
PINNED
Verified
#nil $NIL @nillionnetwork Covenants got my attention. The idea is simple: an instruction goes onchain, but stays sealed until its condition is met, like a price or time trigger. Until then, nobody can read it.
Dusk is the first release of Covenants, and it's live on Ethereum mainnet. For traders, that could mean a stop-loss that isn't visible in advance. I'm also curious how the 7-phase roadmap plays out after Dusk.
My honest doubts: it's still a new network, and a Covenant can't be cancelled once posted. I want to see real usage before getting too excited.
Shared my $NIL trade below. Not financial advice.
#NIL
#nil $NIL @Nillion Covenants got my attention. The idea is simple: an instruction goes onchain, but stays sealed until its condition is met, like a price or time trigger. Until then, nobody can read it.
Dusk is the first release of Covenants, and it's live on Ethereum mainnet. For traders, that could mean a stop-loss that isn't visible in advance. I'm also curious how the 7-phase roadmap plays out after Dusk.
My honest doubts: it's still a new network, and a Covenant can't be cancelled once posted. I want to see real usage before getting too excited.
Shared my $NIL trade below. Not financial advice.
#NIL
24
1
18
192
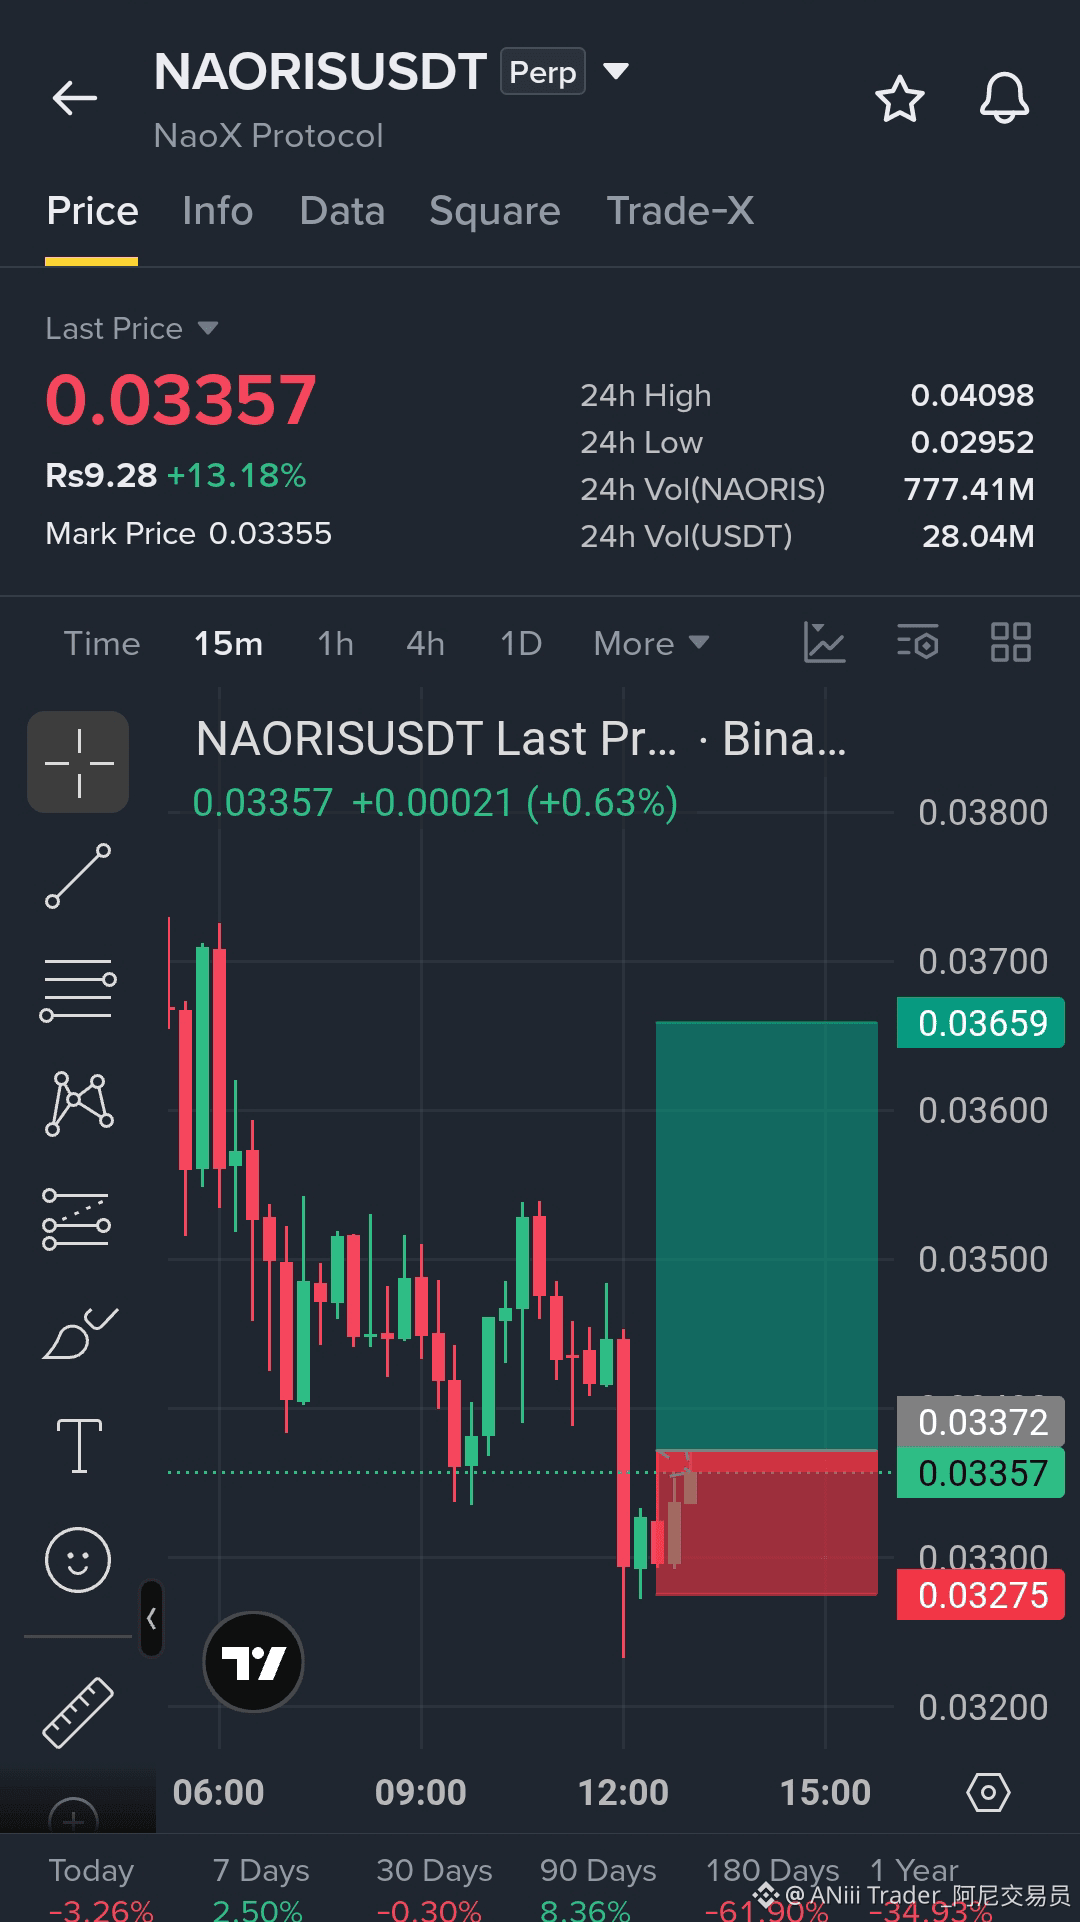
🚨 $NAORIS — Long Setup | Bounce After the Flush (15m)
NAORIS is up about 13% in 24h but down about 3% today, and trades near $0.03357 after a sharp drop from the $0.0355 area. Price is bouncing off the flush low and trying to hold above $0.0333. A hold there offers a cleaner entry than chasing a bigger bounce.
📍 Entry: $0.03340–$0.03360 (limit order)
🎯 TP1: $0.03480
🎯 TP2: $0.03590
🛑 SL: Below $0.03275
Setup: Flush + bounce hold. If $0.03275 breaks on a 15m close, skip the trade. A 15m close above $0.0366 would show buyers back in control.
Do you think $NAORIS holds $0.0333, or retests the flush low? 👇
⚠️ Not financial advice. This is a counter-trend bounce, so keep size small. Use low leverage and strict risk management.
— ANiii Trader Analysis 📊
👇 Click to Open Trade
{future}(NAORISUSDT)
$EVAA
{future}(EVAAUSDT)
🚨 $NAORIS — Long Setup | Bounce After the Flush (15m)
NAORIS is up about 13% in 24h but down about 3% today, and trades near $0.03357 after a sharp drop from the $0.0355 area. Price is bouncing off the flush low and trying to hold above $0.0333. A hold there offers a cleaner entry than chasing a bigger bounce.
📍 Entry: $0.03340–$0.03360 (limit order)
🎯 TP1: $0.03480
🎯 TP2: $0.03590
🛑 SL: Below $0.03275
Setup: Flush + bounce hold. If $0.03275 breaks on a 15m close, skip the trade. A 15m close above $0.0366 would show buyers back in control.
Do you think $NAORIS holds $0.0333, or retests the flush low? 👇
⚠️ Not financial advice. This is a counter-trend bounce, so keep size small. Use low leverage and strict risk management.
— ANiii Trader Analysis 📊
👇 Click to Open Trade
$EVAA
250
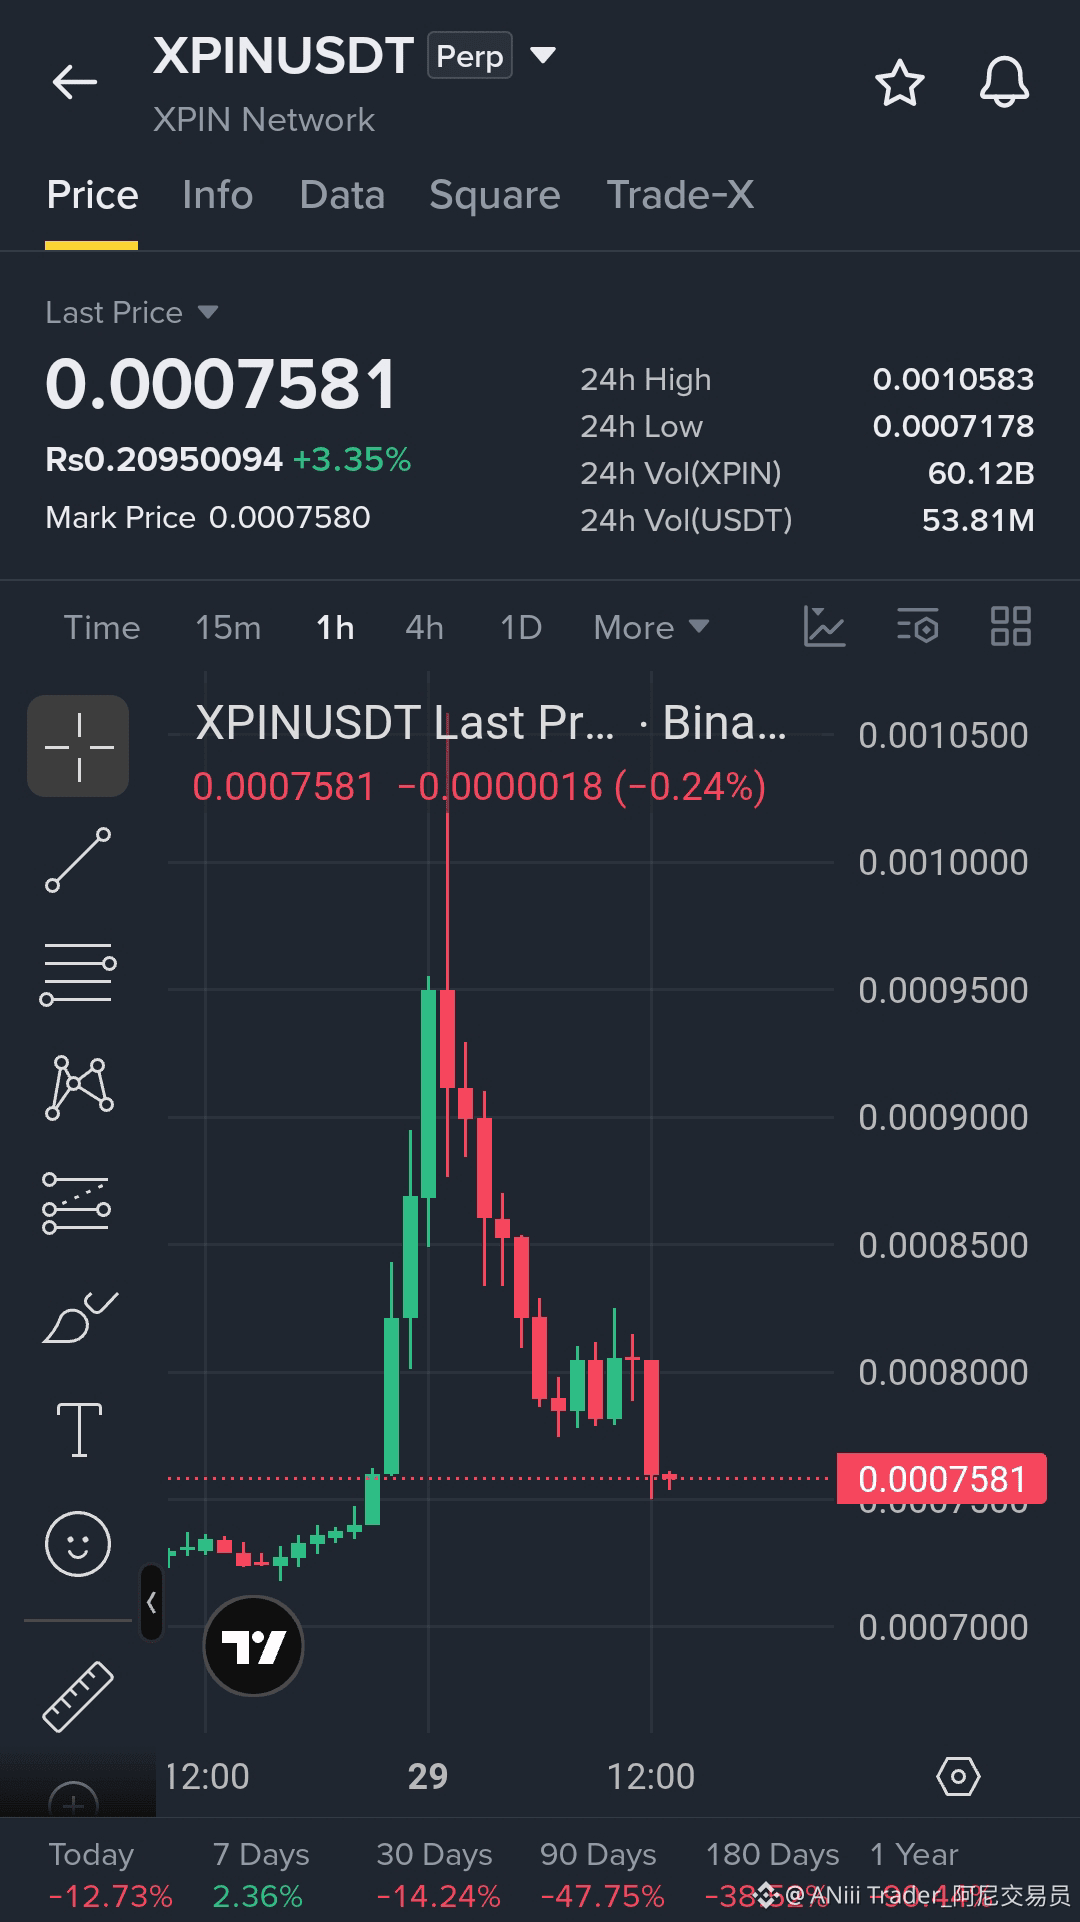
🚨 $XPIN — Short Setup | Spike Rejection, Breakdown Retest (1h)
XPIN is down about 13% today and trades near $0.000758 on $54M in volume, after a spike to $0.001058 was rejected and price lost the $0.000800–$0.000820 range it built on the way down. A weak retest of that broken zone is a cleaner short than selling near the $0.000718 low.
📍 Short Entry: $0.000790–$0.000810 (limit order on retest)
🎯 TP1: $0.000750
🎯 TP2: $0.000720
🛑 SL: Above $0.000845
Setup: Spike rejection + breakdown retest. If $0.000845 breaks on a 1H close, skip the trade. A close below $0.000718 would extend the drop, so don't chase it.
Do you think $XPIN retests $0.00080 and gets rejected, or bounces higher? 👇
⚠️ Not financial advice. XPIN is down about 90% over the past year, so bounces can be sharp. Use low leverage and strict risk management.
— ANiii Trader Analysis 📊
👇 Click to Open Trade
{future}(XPINUSDT)
$IDOL
{future}(IDOLUSDT)
🚨 $XPIN — Short Setup | Spike Rejection, Breakdown Retest (1h)
XPIN is down about 13% today and trades near $0.000758 on $54M in volume, after a spike to $0.001058 was rejected and price lost the $0.000800–$0.000820 range it built on the way down. A weak retest of that broken zone is a cleaner short than selling near the $0.000718 low.
📍 Short Entry: $0.000790–$0.000810 (limit order on retest)
🎯 TP1: $0.000750
🎯 TP2: $0.000720
🛑 SL: Above $0.000845
Setup: Spike rejection + breakdown retest. If $0.000845 breaks on a 1H close, skip the trade. A close below $0.000718 would extend the drop, so don't chase it.
Do you think $XPIN retests $0.00080 and gets rejected, or bounces higher? 👇
⚠️ Not financial advice. XPIN is down about 90% over the past year, so bounces can be sharp. Use low leverage and strict risk management.
— ANiii Trader Analysis 📊
👇 Click to Open Trade
$IDOL
391
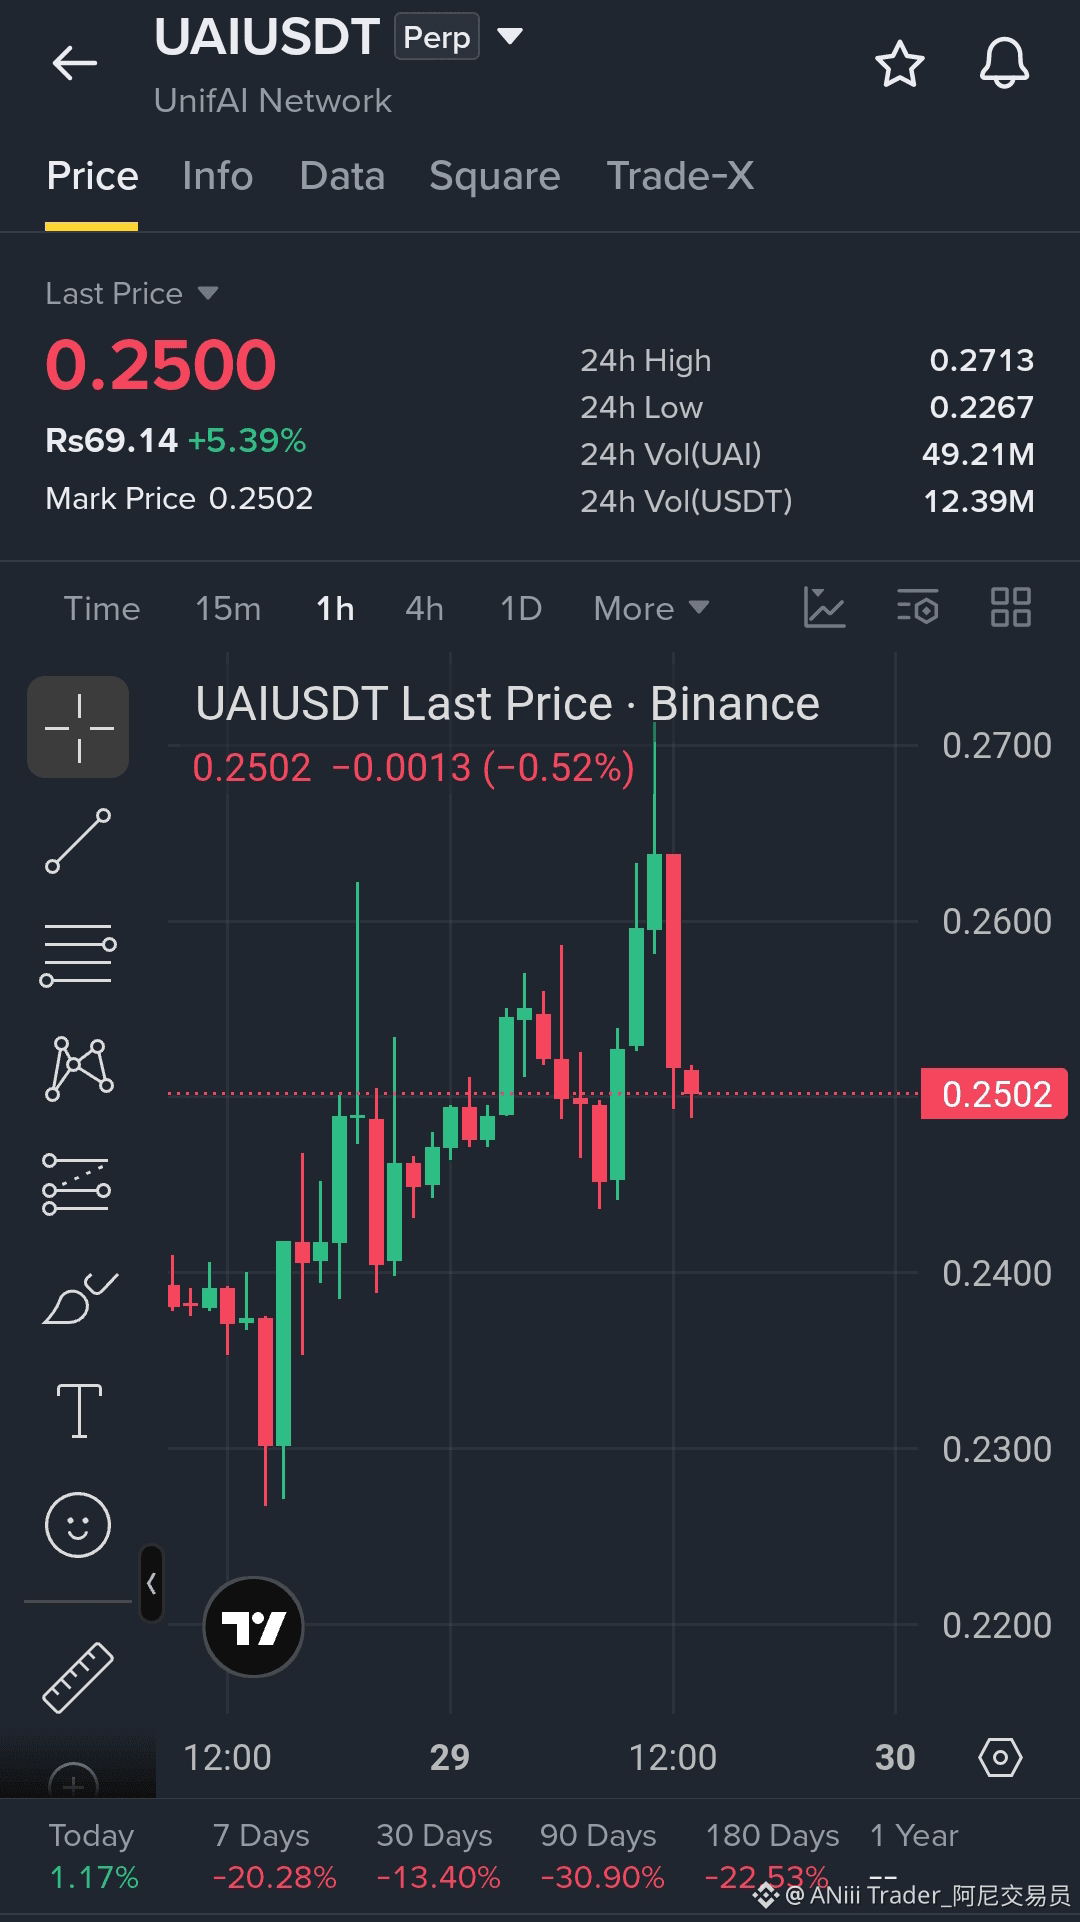
$UAI Breakout Rejected at $0.2713, Holding Above $0.24
UAI trades near $0.2500, up about 5% in 24h on $12M in volume, after a push to a $0.2713 high that was rejected with a long upper wick on the 1h chart. Higher lows from the $0.2267 low are still intact. I'm watching whether $0.2400 holds as support, while a clean 1h close above $0.2600 would show buyers back in control, and a loss of $0.2400 would put $0.2300 back in play.
Does $UAI reclaim $0.26, or slip back toward $0.24?
⚠️ UAI is still down about 20% over 7 days, so rallies can fail fast. Not financial advice.
— ANiii Trader Analysis 📊
👇 Trade on Binance
{future}(UAIUSDT)
$IDOL
{future}(IDOLUSDT)
$UAI Breakout Rejected at $0.2713, Holding Above $0.24
UAI trades near $0.2500, up about 5% in 24h on $12M in volume, after a push to a $0.2713 high that was rejected with a long upper wick on the 1h chart. Higher lows from the $0.2267 low are still intact. I'm watching whether $0.2400 holds as support, while a clean 1h close above $0.2600 would show buyers back in control, and a loss of $0.2400 would put $0.2300 back in play.
Does $UAI reclaim $0.26, or slip back toward $0.24?
⚠️ UAI is still down about 20% over 7 days, so rallies can fail fast. Not financial advice.
— ANiii Trader Analysis 📊
👇 Trade on Binance
$IDOL
179
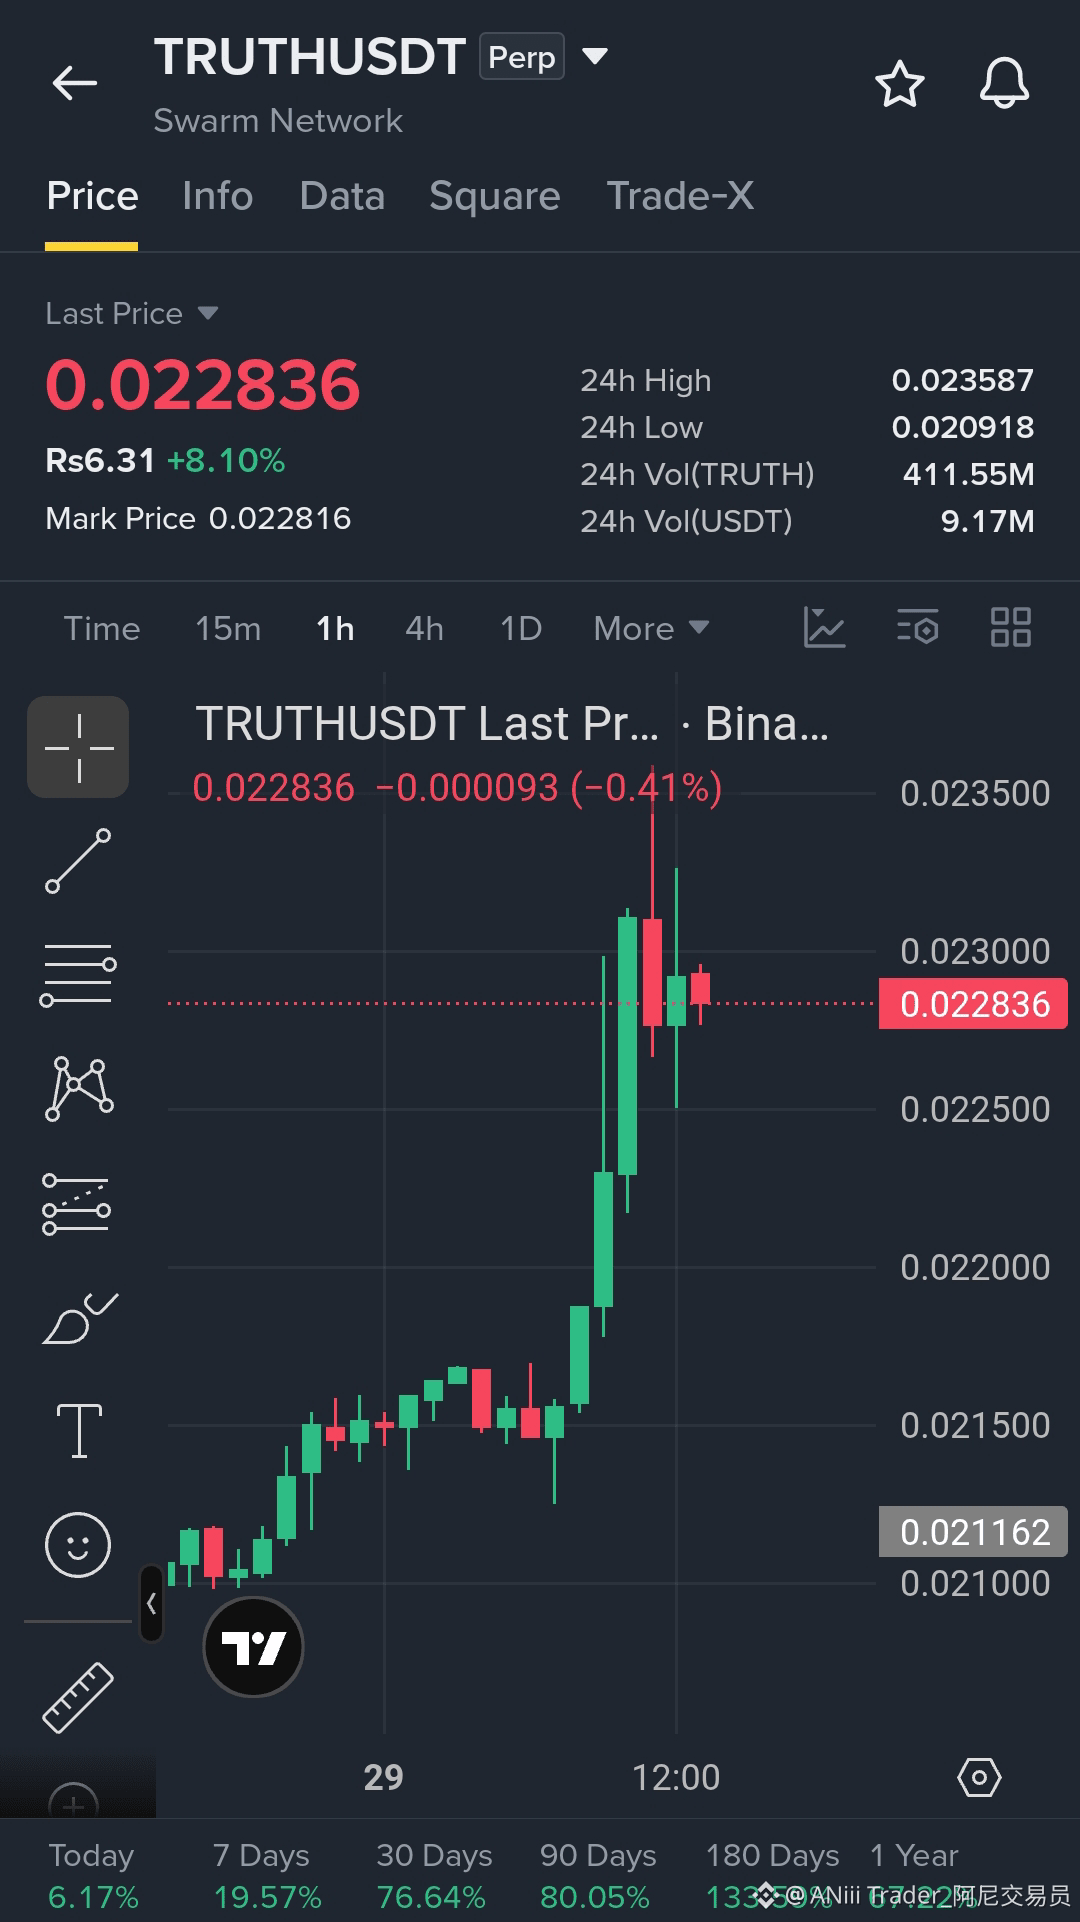
🔍 $TRUTH Strong Rally, Rejected Near $0.0236
TRUTH trades near $0.02284, up about 8% in 24h and up 77% over 30 days, after a vertical push from $0.0215 to a $0.023587 high that was rejected on the 1h chart. I'm watching whether $0.0225 holds as support, since a loss of it opens the way toward $0.0215, while a clean 1h close above $0.0236 would show momentum continuing.
Does $TRUTH hold $0.0225, or give back the rally?
⚠️ Volume is only about $9M after a big 30-day run, so reversals can be sharp. Not financial advice.
— ANiii Trader Analysis 📊
👇 Trade on Binance
{future}(TRUTHUSDT)
$IDOL
{future}(IDOLUSDT)
🔍 $TRUTH Strong Rally, Rejected Near $0.0236
TRUTH trades near $0.02284, up about 8% in 24h and up 77% over 30 days, after a vertical push from $0.0215 to a $0.023587 high that was rejected on the 1h chart. I'm watching whether $0.0225 holds as support, since a loss of it opens the way toward $0.0215, while a clean 1h close above $0.0236 would show momentum continuing.
Does $TRUTH hold $0.0225, or give back the rally?
⚠️ Volume is only about $9M after a big 30-day run, so reversals can be sharp. Not financial advice.
— ANiii Trader Analysis 📊
👇 Trade on Binance
$IDOL
130
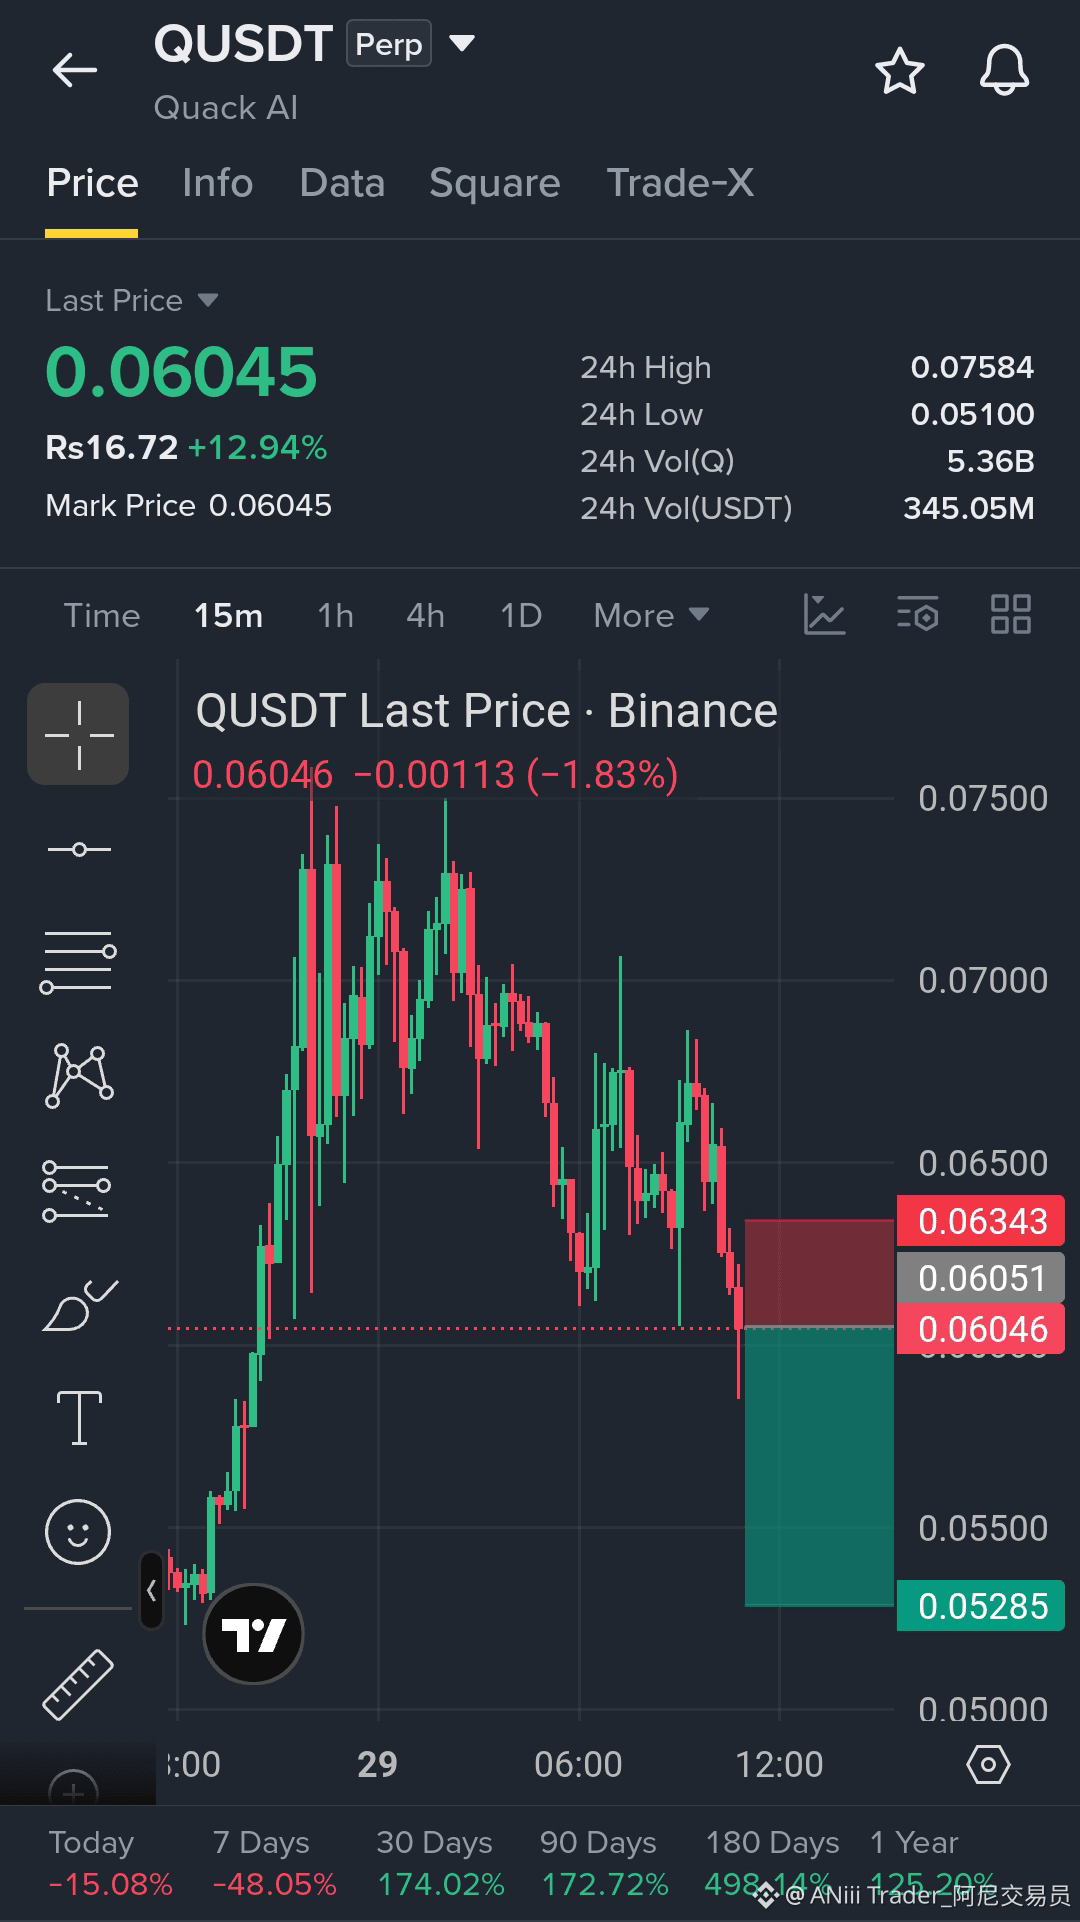
🚨 $Q — Short Setup | Breakdown After the Crash From $0.0758 (15m)
Q is down about 15% on the day and trades near $0.0605 on $345M volume, after losing the $0.0620–$0.0630 area that held as support for hours. Lower highs from the $0.0758 peak keep sellers in control. A bounce into the broken zone is a cleaner short than selling the dip.
📍 Short Entry: $0.0600–$0.0612 (limit order on bounce)
🎯 TP1: $0.0580
🎯 TP2: $0.0555
🛑 SL: Above $0.0634
Setup: Breakdown + lower highs. If $0.0634 breaks on a 15m close, skip the trade. Q is already down about 48% over 7 days, so bounces can be sharp.
Do you think $Q reaches $0.0555, or squeezes back above $0.0630? 👇
⚠️ Not financial advice. Use low leverage and strict risk management.
— ANiii Trader Analysis 📊
👇 Click to Open Trade
{future}(QUSDT)
$IDOL
{future}(IDOLUSDT)
🚨 $Q — Short Setup | Breakdown After the Crash From $0.0758 (15m)
Q is down about 15% on the day and trades near $0.0605 on $345M volume, after losing the $0.0620–$0.0630 area that held as support for hours. Lower highs from the $0.0758 peak keep sellers in control. A bounce into the broken zone is a cleaner short than selling the dip.
📍 Short Entry: $0.0600–$0.0612 (limit order on bounce)
🎯 TP1: $0.0580
🎯 TP2: $0.0555
🛑 SL: Above $0.0634
Setup: Breakdown + lower highs. If $0.0634 breaks on a 15m close, skip the trade. Q is already down about 48% over 7 days, so bounces can be sharp.
Do you think $Q reaches $0.0555, or squeezes back above $0.0630? 👇
⚠️ Not financial advice. Use low leverage and strict risk management.
— ANiii Trader Analysis 📊
👇 Click to Open Trade
$IDOL
303
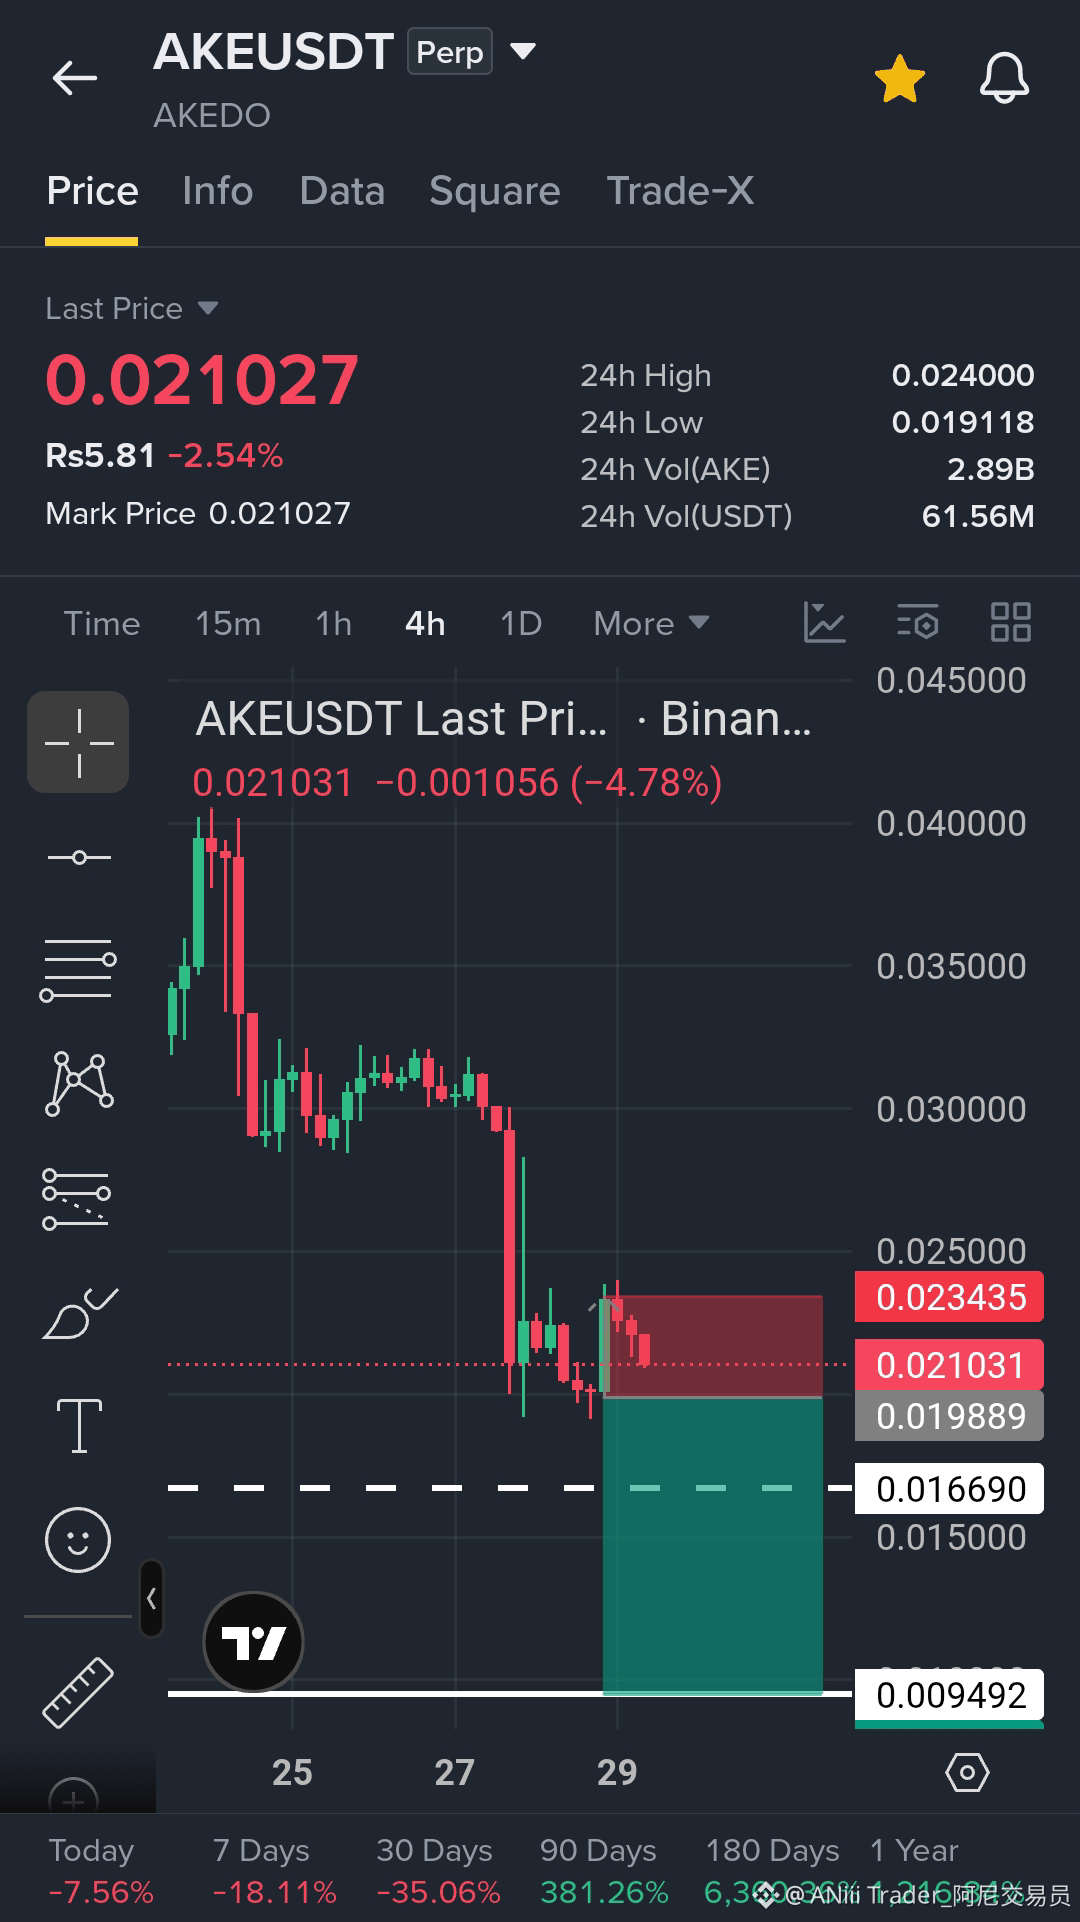
🚨 $AKE — Short Setup | Weak Bounce After the Crash (4h)
AKE trades near $0.0210, down about 7.6% on the day and 18% over 7 days, after crashing from the $0.045 area and bouncing only back into the $0.0215–$0.0225 zone on the 4h chart. Volume is $62M. Lower highs keep sellers in control, and the $0.0167 level is the next support below.
📍 Short Entry: $0.0208–$0.0214 (limit order on bounce)
🎯 TP1: $0.0192
🎯 TP2: $0.0167
🛑 SL: Above $0.0235
Setup: Lower highs + weak bounce. If $0.0235 breaks on a 4H close, skip the trade. A close below $0.0192 would extend the drop, so don't chase it.
Do you think $AKE loses $0.0192, or bounces back toward $0.0235? 👇
⚠️ Not financial advice. AKE is up about 6,360% over 180 days, so moves can be extreme both ways. Use low leverage and strict risk management.
— ANiii Trader Analysis 📊
👇 Click to Open Trade
{future}(AKEUSDT)
$IDOL
{future}(IDOLUSDT)
🚨 $AKE — Short Setup | Weak Bounce After the Crash (4h)
AKE trades near $0.0210, down about 7.6% on the day and 18% over 7 days, after crashing from the $0.045 area and bouncing only back into the $0.0215–$0.0225 zone on the 4h chart. Volume is $62M. Lower highs keep sellers in control, and the $0.0167 level is the next support below.
📍 Short Entry: $0.0208–$0.0214 (limit order on bounce)
🎯 TP1: $0.0192
🎯 TP2: $0.0167
🛑 SL: Above $0.0235
Setup: Lower highs + weak bounce. If $0.0235 breaks on a 4H close, skip the trade. A close below $0.0192 would extend the drop, so don't chase it.
Do you think $AKE loses $0.0192, or bounces back toward $0.0235? 👇
⚠️ Not financial advice. AKE is up about 6,360% over 180 days, so moves can be extreme both ways. Use low leverage and strict risk management.
— ANiii Trader Analysis 📊
👇 Click to Open Trade
$IDOL
238
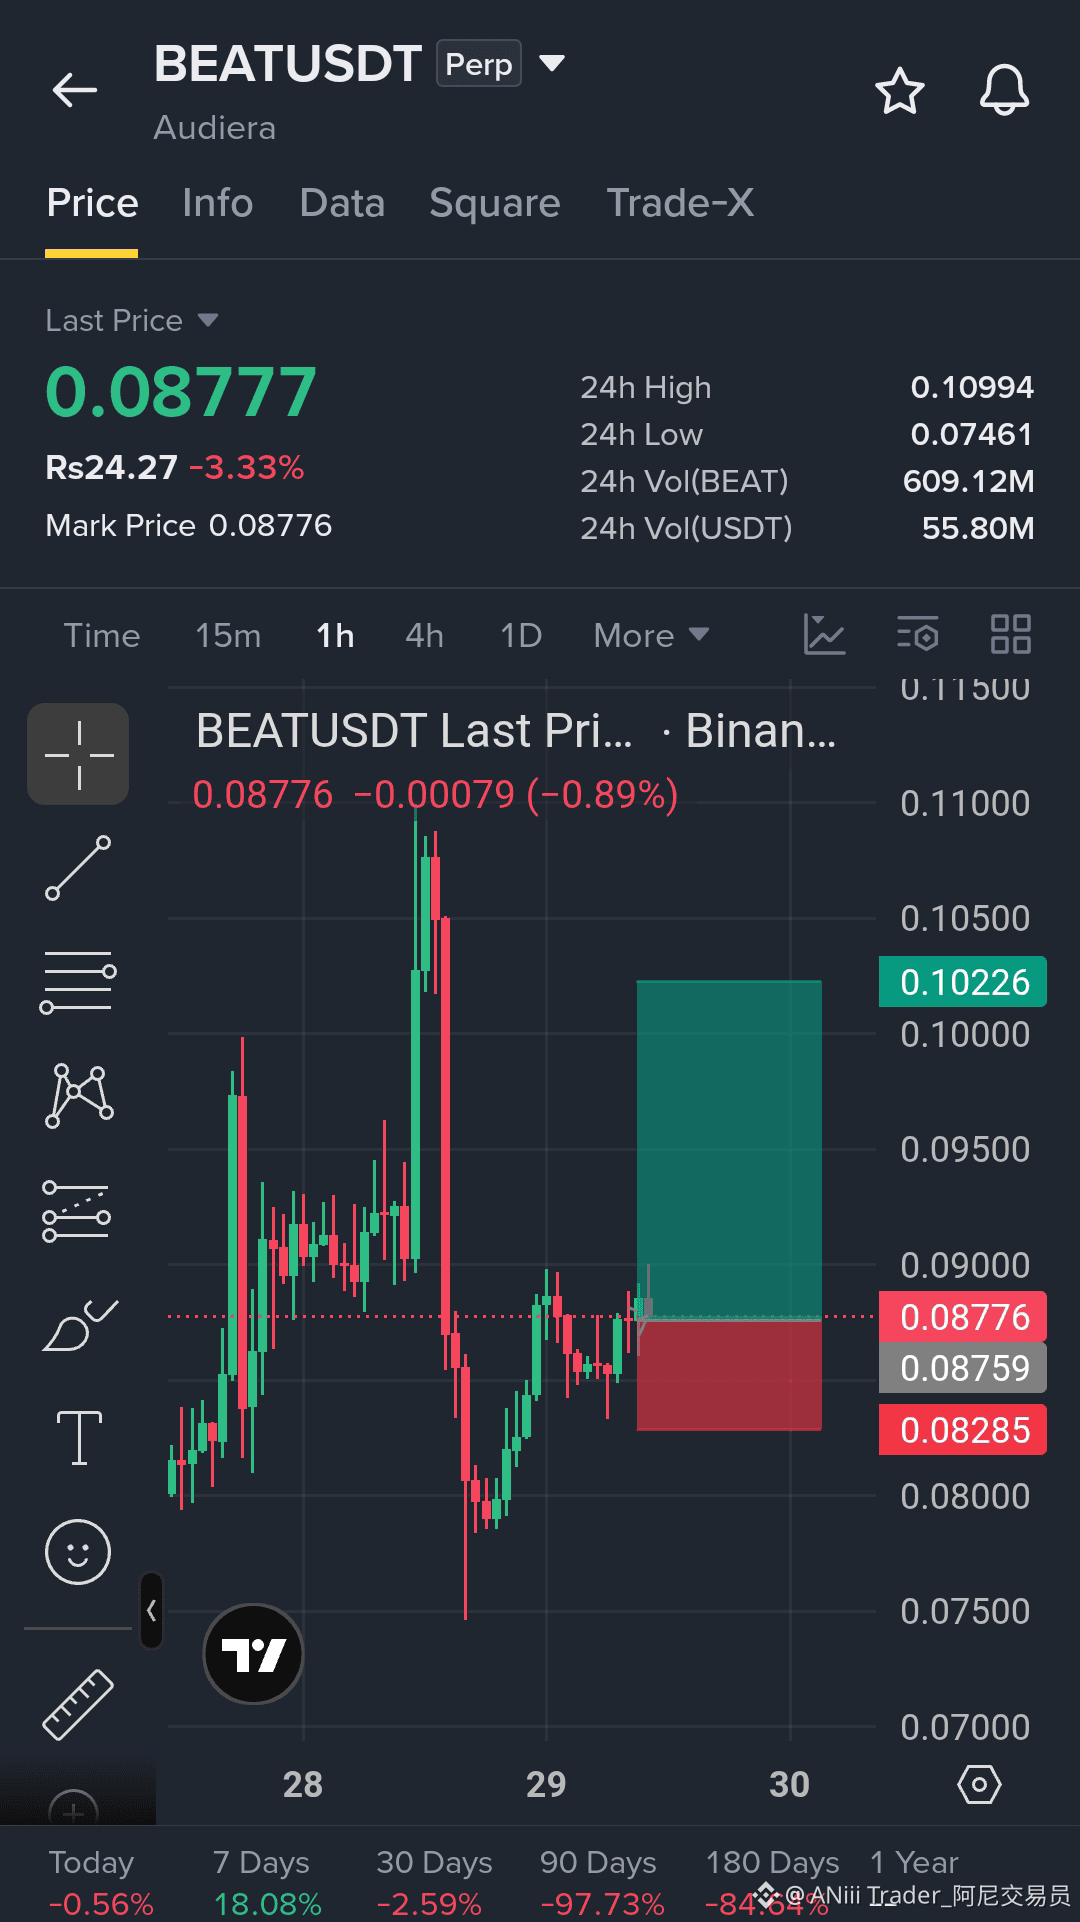
🚨 $BEAT — Long Setup | Higher Lows After the Flush (1h)
BEAT trades near $0.0878, down about 3% in 24h on $56M volume, after dumping from the $0.1099 high to $0.0746 and rebuilding higher lows on the 1h chart. The $0.0828–$0.0850 zone is the support to watch, and $0.0910 is the first resistance.
📍 Entry: $0.0870–$0.0880 (limit order)
🎯 TP1: $0.0910
🎯 TP2: $0.0950
🛑 SL: Below $0.0828
Setup: Higher lows + base hold. If $0.0828 breaks on a 1H close, skip the trade. A 1H close above $0.0950 would show buyers back in control.
Do you think $BEAT retakes $0.10, or fades back into the base? 👇
⚠️ Not financial advice. BEAT is down about 97% over 90 days, so rallies can reverse fast. Use low leverage and strict risk management.
— ANiii Trader Analysis 📊
👇 Click to Open Trade
{future}(BEATUSDT)
$IDOL
{future}(IDOLUSDT)
🚨 $BEAT — Long Setup | Higher Lows After the Flush (1h)
BEAT trades near $0.0878, down about 3% in 24h on $56M volume, after dumping from the $0.1099 high to $0.0746 and rebuilding higher lows on the 1h chart. The $0.0828–$0.0850 zone is the support to watch, and $0.0910 is the first resistance.
📍 Entry: $0.0870–$0.0880 (limit order)
🎯 TP1: $0.0910
🎯 TP2: $0.0950
🛑 SL: Below $0.0828
Setup: Higher lows + base hold. If $0.0828 breaks on a 1H close, skip the trade. A 1H close above $0.0950 would show buyers back in control.
Do you think $BEAT retakes $0.10, or fades back into the base? 👇
⚠️ Not financial advice. BEAT is down about 97% over 90 days, so rallies can reverse fast. Use low leverage and strict risk management.
— ANiii Trader Analysis 📊
👇 Click to Open Trade
$IDOL
216
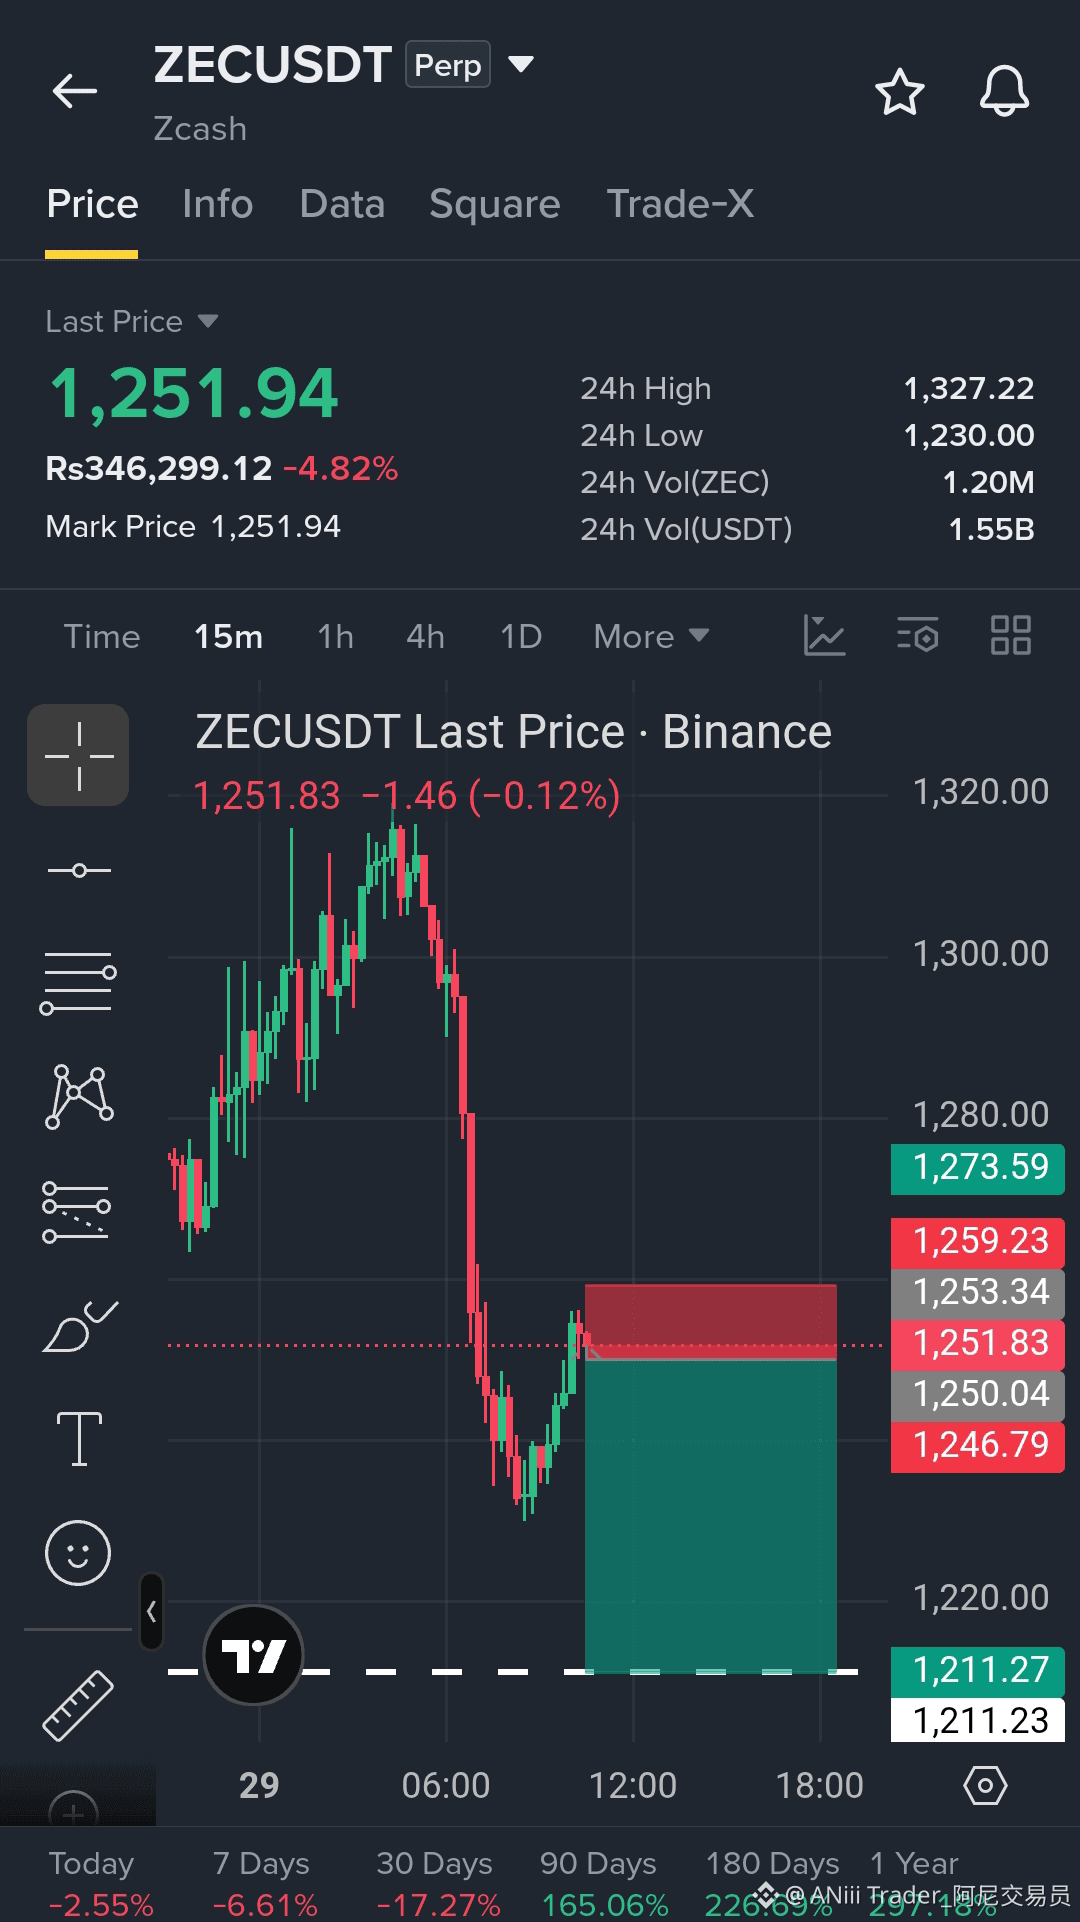
🚨 $ZEC — Short Setup | Bounce Stalling at Resistance (15m)
ZEC is down about 5% in 24h and trades near $1,252 on $1.55B in volume, after bouncing from the $1,230 low and stalling just under $1,259. Lower highs from the $1,327 peak keep sellers in control. A rejection around $1,250–$1,255 offers a cleaner short than selling the low.
📍 Short Entry: $1,250–$1,255 (limit order on bounce)
🎯 TP1: $1,240
🎯 TP2: $1,230
🛑 SL: Above $1,259.5
Setup: Lower highs + resistance rejection. If $1,259.5 breaks on a 15m close, skip the trade. A close below $1,230 would extend the drop, so don't chase it.
Do you think $ZEC loses $1,230, or recovers toward $1,275? 👇
⚠️ Not financial advice. Use low leverage and strict risk management.
— ANiii Trader Analysis 📊
👇 Click to Open Trade
{spot}(ZECUSDT)
$IDOL
{future}(IDOLUSDT)
🚨 $ZEC — Short Setup | Bounce Stalling at Resistance (15m)
ZEC is down about 5% in 24h and trades near $1,252 on $1.55B in volume, after bouncing from the $1,230 low and stalling just under $1,259. Lower highs from the $1,327 peak keep sellers in control. A rejection around $1,250–$1,255 offers a cleaner short than selling the low.
📍 Short Entry: $1,250–$1,255 (limit order on bounce)
🎯 TP1: $1,240
🎯 TP2: $1,230
🛑 SL: Above $1,259.5
Setup: Lower highs + resistance rejection. If $1,259.5 breaks on a 15m close, skip the trade. A close below $1,230 would extend the drop, so don't chase it.
Do you think $ZEC loses $1,230, or recovers toward $1,275? 👇
⚠️ Not financial advice. Use low leverage and strict risk management.
— ANiii Trader Analysis 📊
👇 Click to Open Trade
$IDOL
197
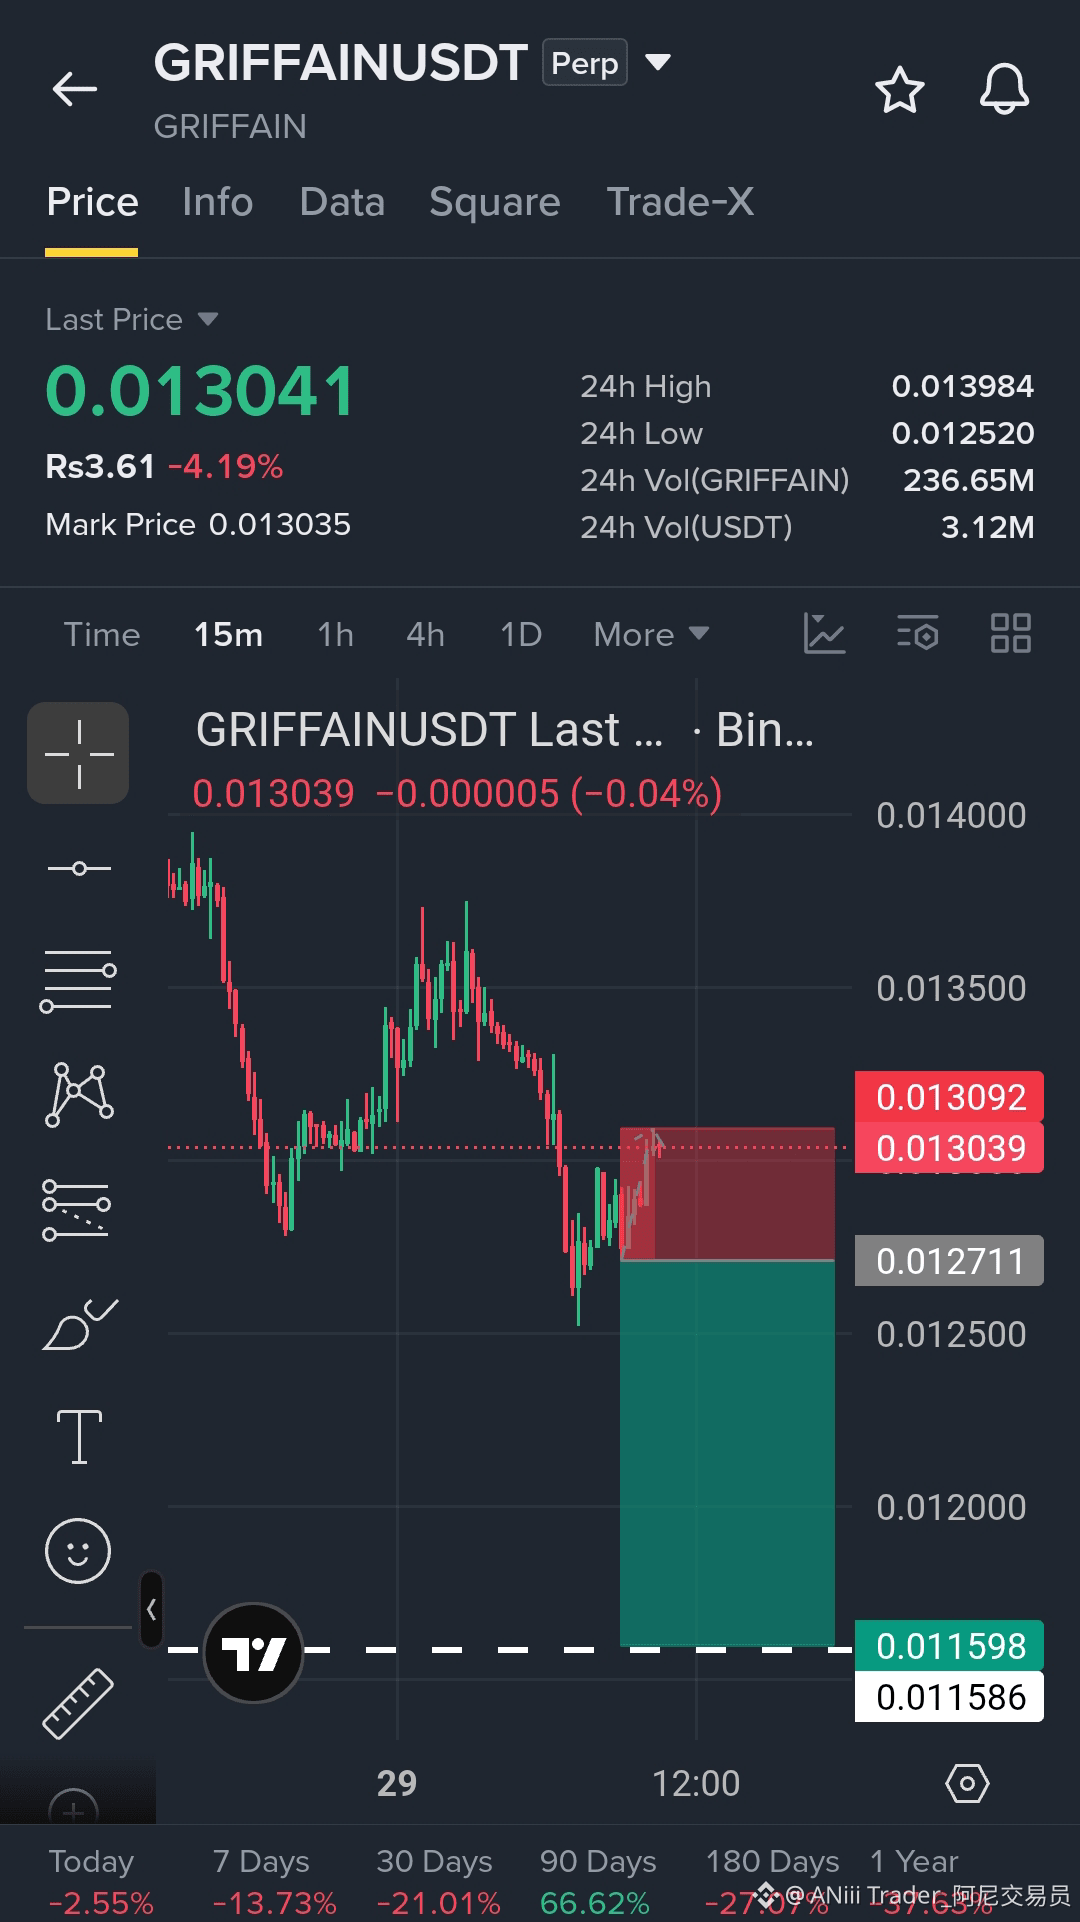
🚨 $GRIFFAIN — Short Setup | Support Breakdown Watch (15m)
GRIFFAIN is down about 4% in 24h and about 14% over 7 days, trading near $0.01304 on thin $3M volume, with the $0.0127 area acting as the support to watch. A 15m close below it would confirm sellers, while the bounce keeps failing near $0.0131.
📍 Short Entry: $0.01265–$0.01275 (on a 15m close below $0.0127)
🎯 TP1: $0.01230
🎯 TP2: $0.01200
🛑 SL: Above $0.01310
Setup: Support breakdown. If $0.0131 breaks on a 15m close, skip the trade. If $0.0127 holds with a strong bounce, the idea is invalid.
Do you think $GRIFFAIN breaks $0.0127, or holds this support? 👇
⚠️ Not financial advice. Volume is thin, so expect wide swings. Use low leverage and strict risk management.
— ANiii Trader Analysis 📊
👇 Click to Open Trade
{future}(GRIFFAINUSDT)
$IDOL
{future}(IDOLUSDT)
🚨 $GRIFFAIN — Short Setup | Support Breakdown Watch (15m)
GRIFFAIN is down about 4% in 24h and about 14% over 7 days, trading near $0.01304 on thin $3M volume, with the $0.0127 area acting as the support to watch. A 15m close below it would confirm sellers, while the bounce keeps failing near $0.0131.
📍 Short Entry: $0.01265–$0.01275 (on a 15m close below $0.0127)
🎯 TP1: $0.01230
🎯 TP2: $0.01200
🛑 SL: Above $0.01310
Setup: Support breakdown. If $0.0131 breaks on a 15m close, skip the trade. If $0.0127 holds with a strong bounce, the idea is invalid.
Do you think $GRIFFAIN breaks $0.0127, or holds this support? 👇
⚠️ Not financial advice. Volume is thin, so expect wide swings. Use low leverage and strict risk management.
— ANiii Trader Analysis 📊
👇 Click to Open Trade
$IDOL
206
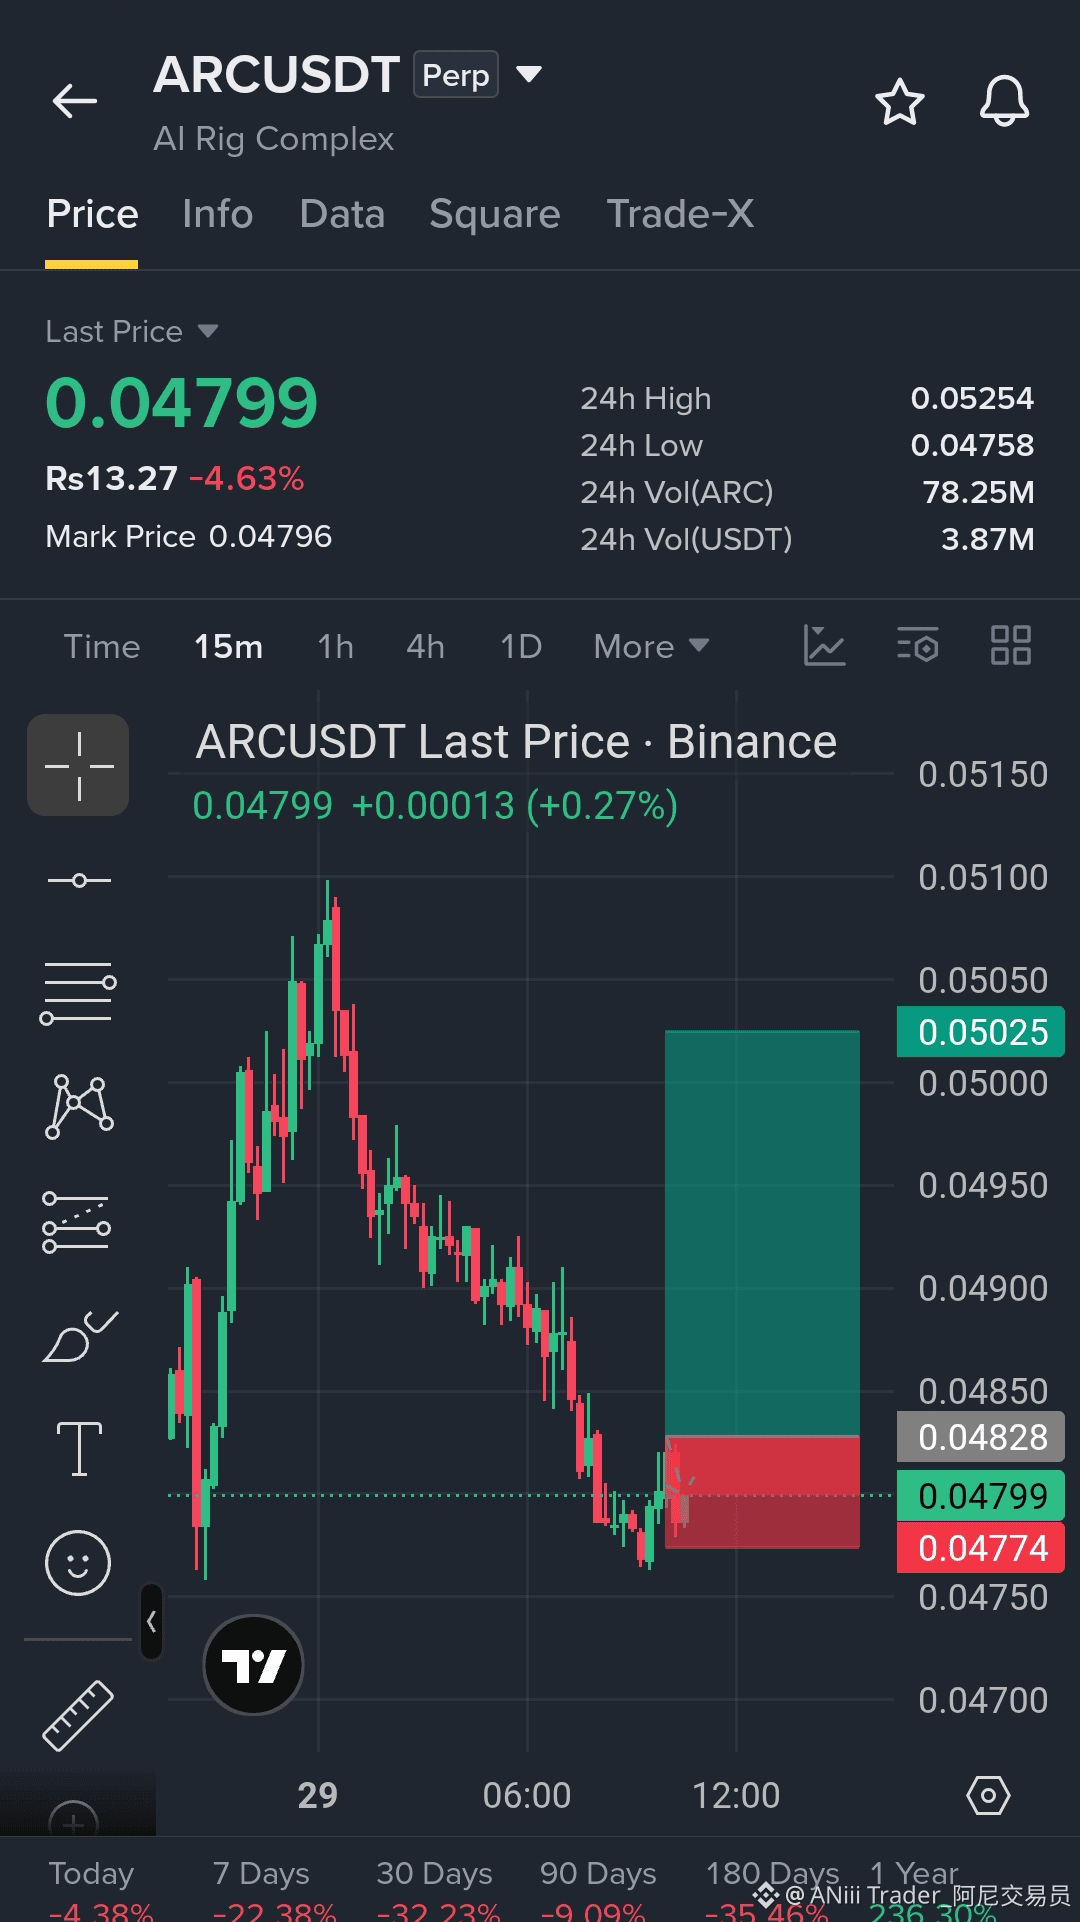
🚨 $ARC — Long Setup | Reclaim of $0.0483 After the Sell-Off (15m)
ARC is down about 4.6% in 24h and trades near $0.04799, just above its $0.04758 low, after a steady slide from $0.0525. A 15m close back above $0.0483 would show buyers stepping in and turn that level into support.
📍 Entry: $0.04830–$0.04840 (on a 15m close above $0.0483)
🎯 TP1: $0.04900
🎯 TP2: $0.04950
🛑 SL: Below $0.04770
Setup: Support bounce + level reclaim. If $0.0477 breaks, skip the trade. This is a counter-trend bounce, so keep targets short.
Do you think $ARC reclaims $0.0483, or makes a new low? 👇
⚠️ Not financial advice. ARC is down about 22% over 7 days and volume is thin. Use low leverage and strict risk management.
— ANiii Trader Analysis 📊
👇 Click to Open Trade
{future}(ARCUSDT)
$IDOL
🚨 $ARC — Long Setup | Reclaim of $0.0483 After the Sell-Off (15m)
ARC is down about 4.6% in 24h and trades near $0.04799, just above its $0.04758 low, after a steady slide from $0.0525. A 15m close back above $0.0483 would show buyers stepping in and turn that level into support.
📍 Entry: $0.04830–$0.04840 (on a 15m close above $0.0483)
🎯 TP1: $0.04900
🎯 TP2: $0.04950
🛑 SL: Below $0.04770
Setup: Support bounce + level reclaim. If $0.0477 breaks, skip the trade. This is a counter-trend bounce, so keep targets short.
Do you think $ARC reclaims $0.0483, or makes a new low? 👇
⚠️ Not financial advice. ARC is down about 22% over 7 days and volume is thin. Use low leverage and strict risk management.
— ANiii Trader Analysis 📊
👇 Click to Open Trade
$IDOL
3
181
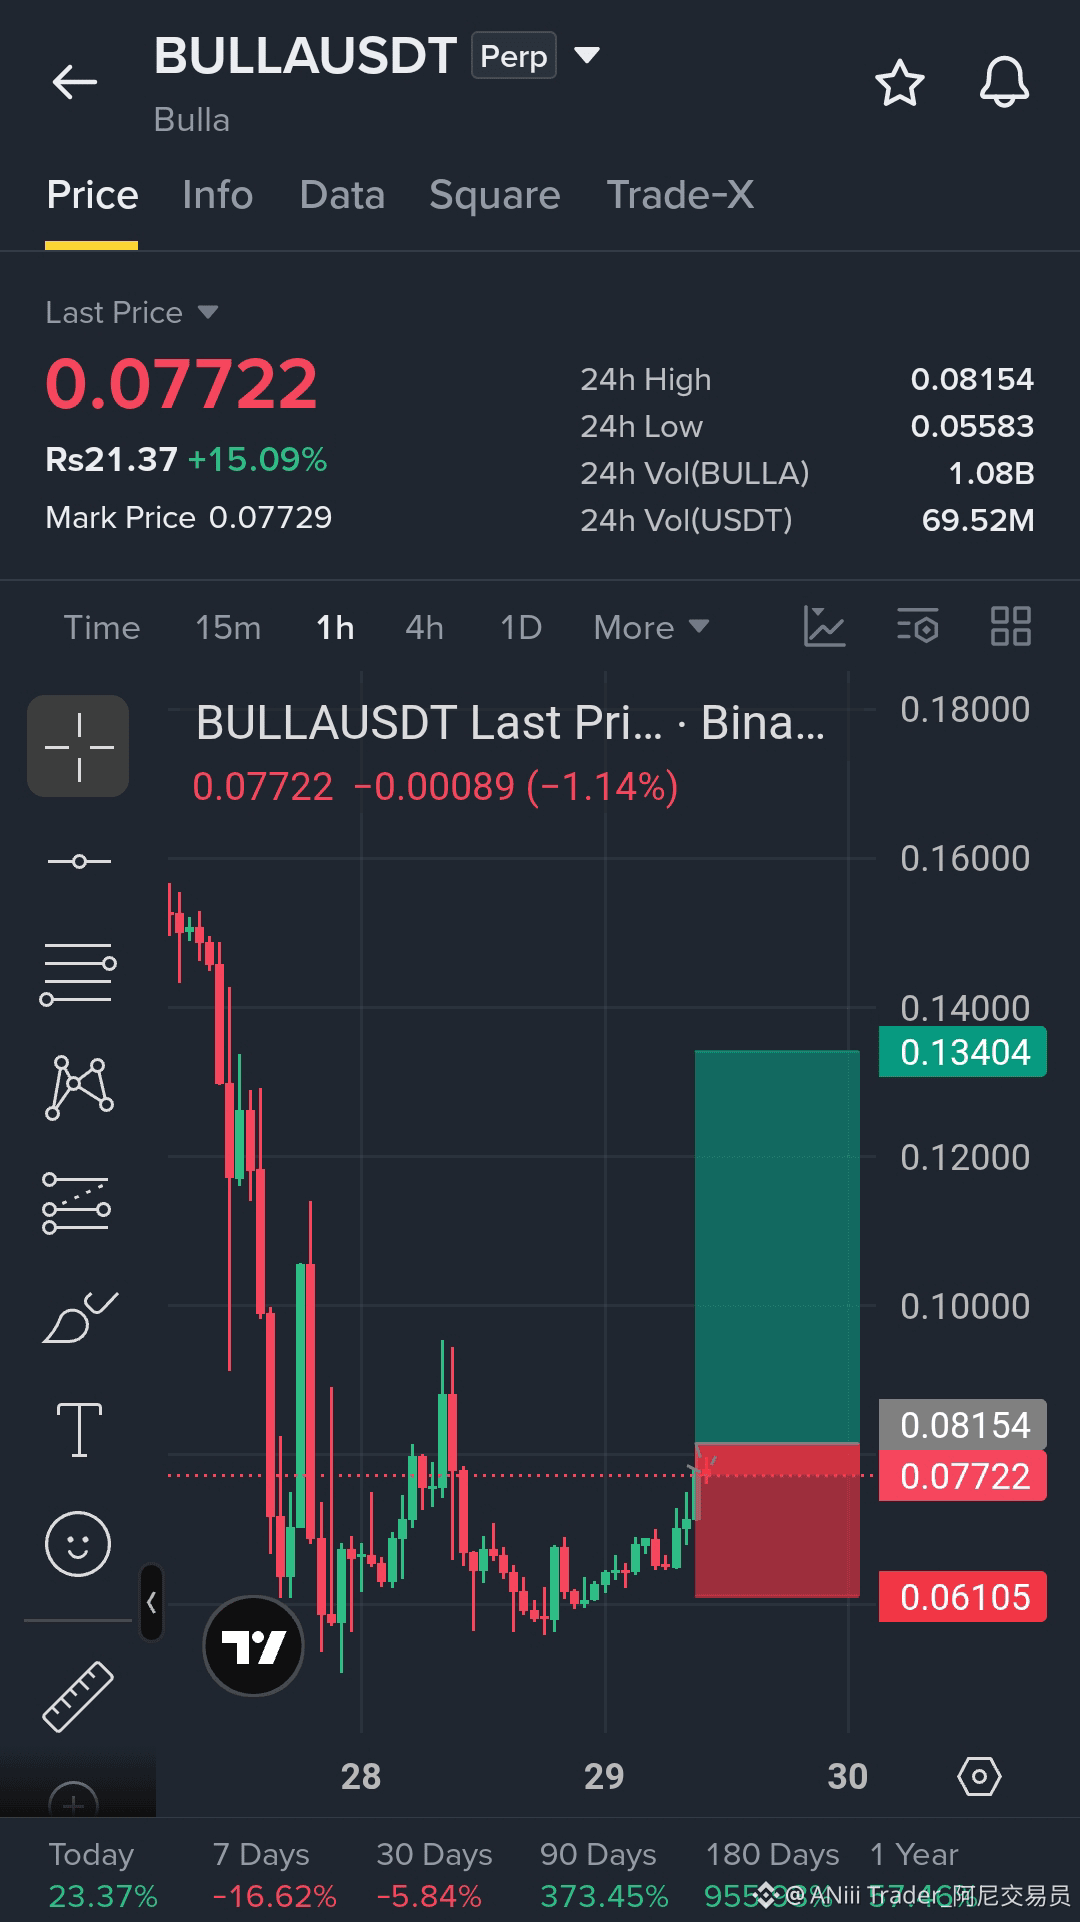
🚨 $BULLA — Long Setup | Recovery After the Flush (1h)
BULLA is up about 15% in 24h and trades near $0.07722 on $70M in volume, after a bounce from the $0.0558 low and a base forming above $0.0610. The 24h high at $0.0815 is the first resistance, with $0.0900 above it.
📍 Entry: $0.0760–$0.0775 (limit order)
🎯 TP1: $0.0815
🎯 TP2: $0.0900
🛑 SL: Below $0.0610
Setup: Base + recovery bounce. If $0.0610 breaks on a 1H close, skip the trade. A 1H close above $0.0815 would show buyers in control.
Do you think $BULLA breaks $0.0815, or fades back into the base? 👇
⚠️ Not financial advice. BULLA is up about 955% over 180 days, so moves can reverse fast. Use low leverage and strict risk management.
— ANiii Trader Analysis 📊
👇 Click to Open Trade
{future}(BULLAUSDT)
$IDOL
{future}(IDOLUSDT)
🚨 $BULLA — Long Setup | Recovery After the Flush (1h)
BULLA is up about 15% in 24h and trades near $0.07722 on $70M in volume, after a bounce from the $0.0558 low and a base forming above $0.0610. The 24h high at $0.0815 is the first resistance, with $0.0900 above it.
📍 Entry: $0.0760–$0.0775 (limit order)
🎯 TP1: $0.0815
🎯 TP2: $0.0900
🛑 SL: Below $0.0610
Setup: Base + recovery bounce. If $0.0610 breaks on a 1H close, skip the trade. A 1H close above $0.0815 would show buyers in control.
Do you think $BULLA breaks $0.0815, or fades back into the base? 👇
⚠️ Not financial advice. BULLA is up about 955% over 180 days, so moves can reverse fast. Use low leverage and strict risk management.
— ANiii Trader Analysis 📊
👇 Click to Open Trade
$IDOL
2
157
🎙️ Construction Plaza: Ongoing airdrops—just update your avatar and name as instructed!

End
04 h 01 m 52 s
4.2k
13
13
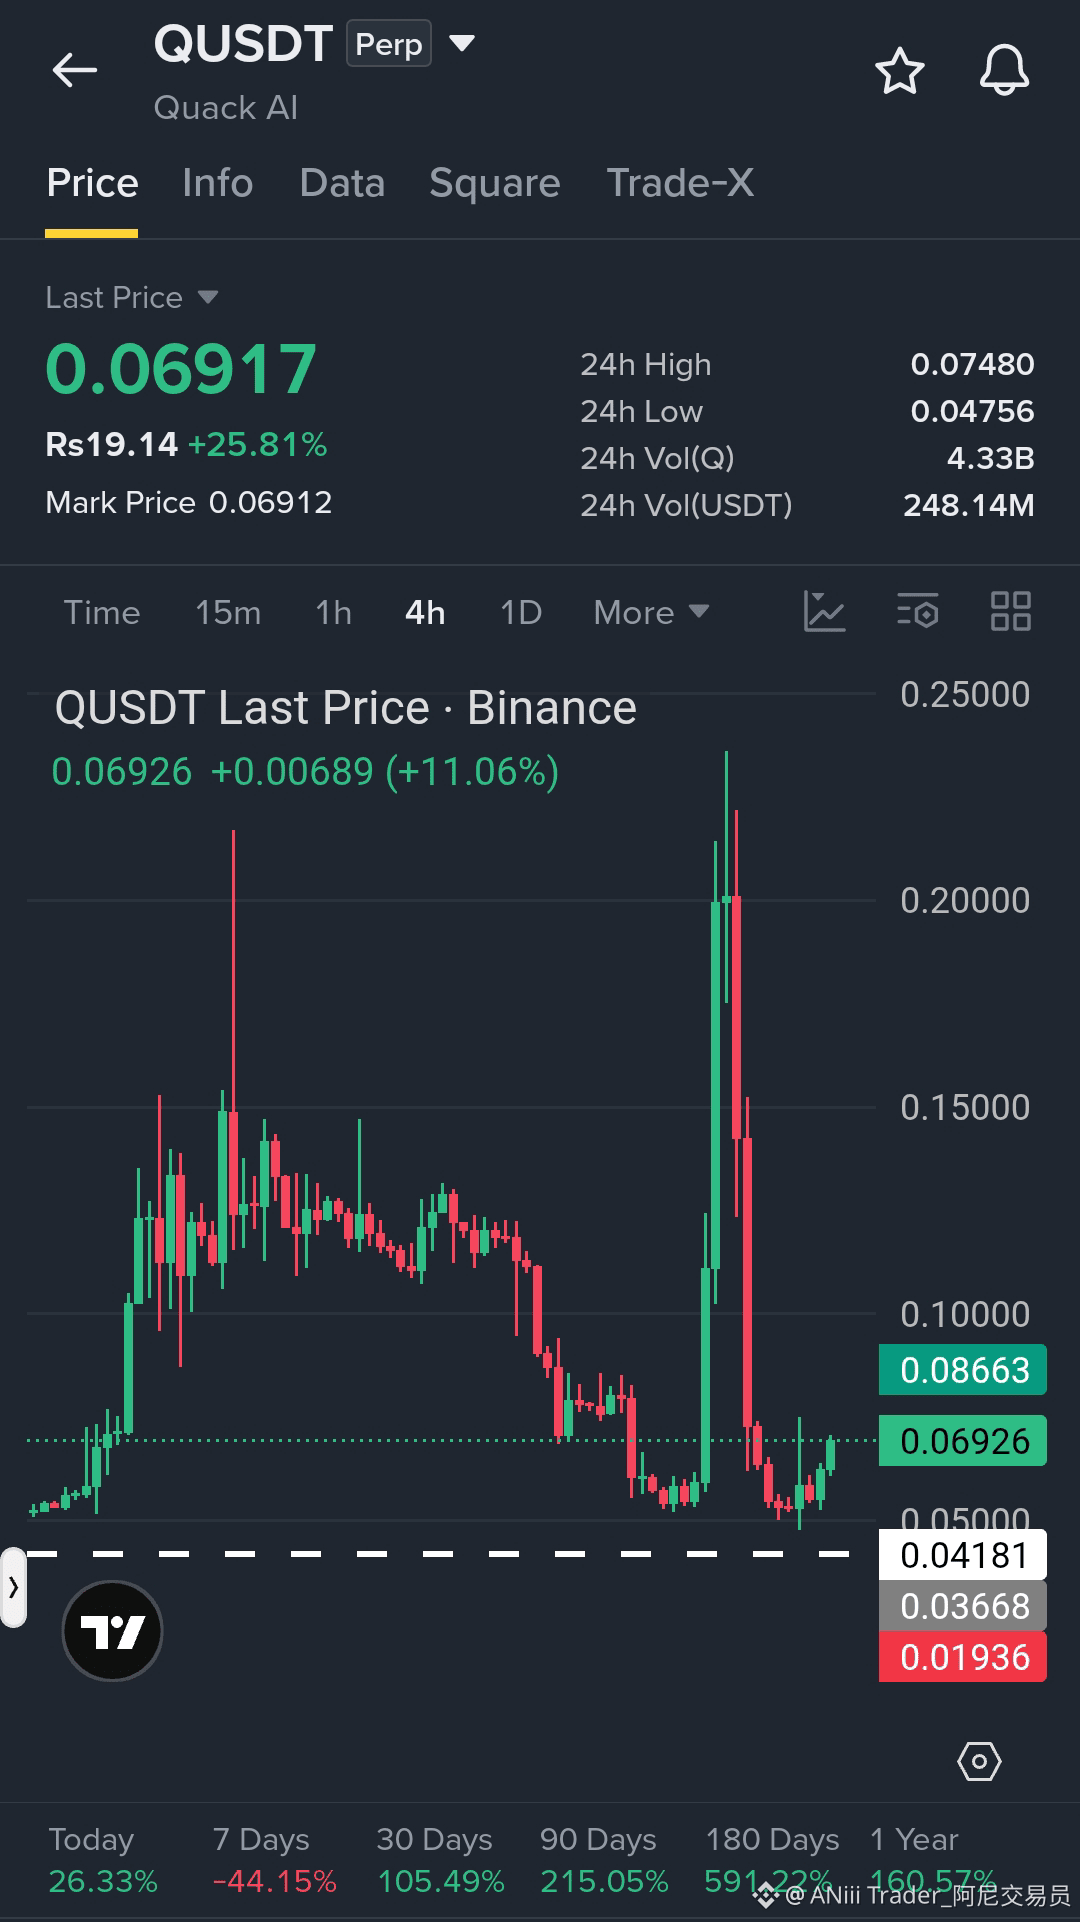
🚨 $Q LONG — Accumulation Base & Support Rebound Setup
{future}(QUSDT)
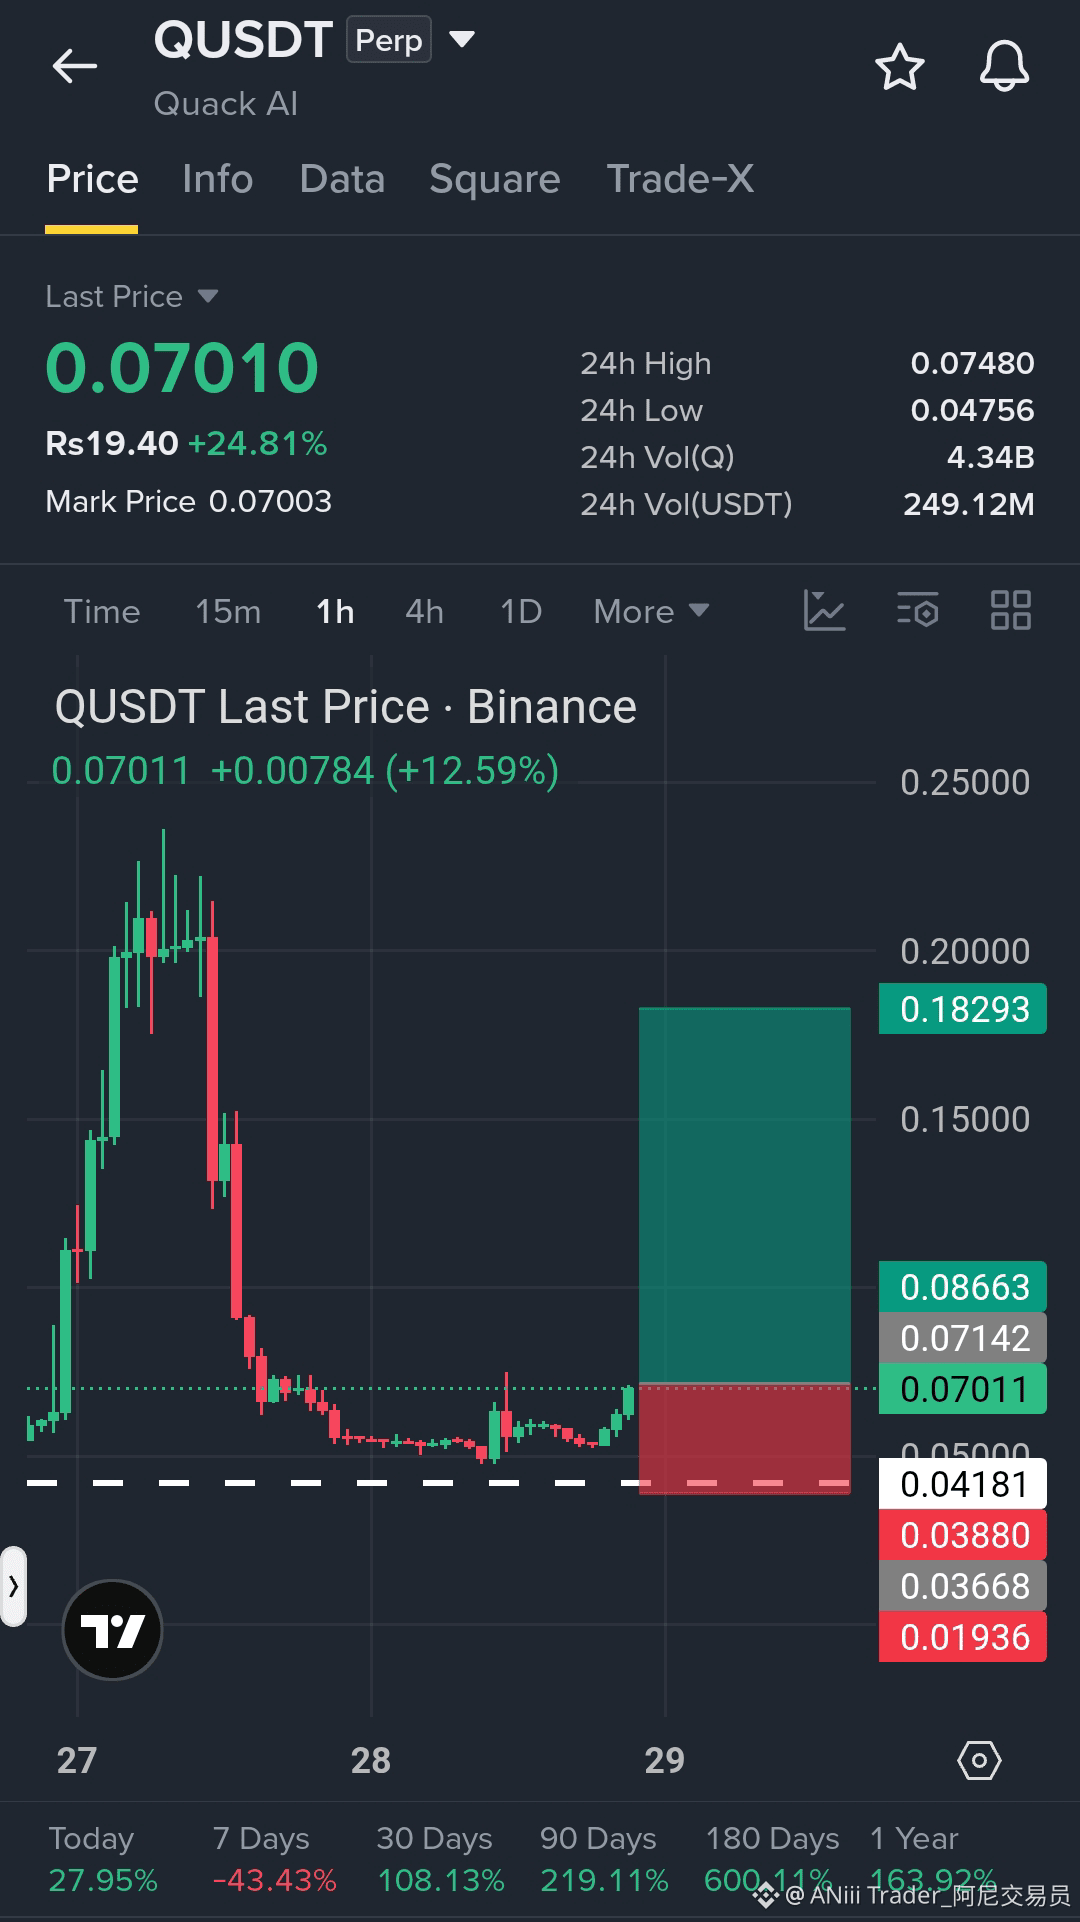
Q is trading around 0.06917 with a +25.81% daily gain, showcasing a strong recovery bounce on the 4-hour chart after defending the demand base near 0.04756. The price is building an accumulation structure and pressing toward the immediate 0.0714 resistance zone. I am waiting for a confirmed candle close and hold above this level to validate the continuation leg upward.
— ANiii Trader Analysis 📊
📍 Entry: 0.06800 - 0.07050
🎯 TP1: 0.08663
🎯 TP2: 0.10293
🛑 SL: 0.04181
📊 R:R: 1:2.4
Setup: Accumulation Base → Confirmed Break & Hold Above 0.0714 → Potential Long Continuation
⚠️ High volatility following sharp trend shifts; manage position size tightly. Not financial advice.
Do you expect $Q to clear the 0.0714 resistance and extend toward higher targets on this recovery run?
👇 Click to Open Trade
{future}(QUSDT)
$EVAA
{future}(EVAAUSDT)
🚨 $Q LONG — Accumulation Base & Support Rebound Setup
Q is trading around 0.06917 with a +25.81% daily gain, showcasing a strong recovery bounce on the 4-hour chart after defending the demand base near 0.04756. The price is building an accumulation structure and pressing toward the immediate 0.0714 resistance zone. I am waiting for a confirmed candle close and hold above this level to validate the continuation leg upward.
— ANiii Trader Analysis 📊
📍 Entry: 0.06800 - 0.07050
🎯 TP1: 0.08663
🎯 TP2: 0.10293
🛑 SL: 0.04181
📊 R:R: 1:2.4
Setup: Accumulation Base → Confirmed Break & Hold Above 0.0714 → Potential Long Continuation
⚠️ High volatility following sharp trend shifts; manage position size tightly. Not financial advice.
Do you expect $Q to clear the 0.0714 resistance and extend toward higher targets on this recovery run?
👇 Click to Open Trade
$EVAA
371
$LYN Analysis — Recovery Bounce Testing Mid-Range Resistance
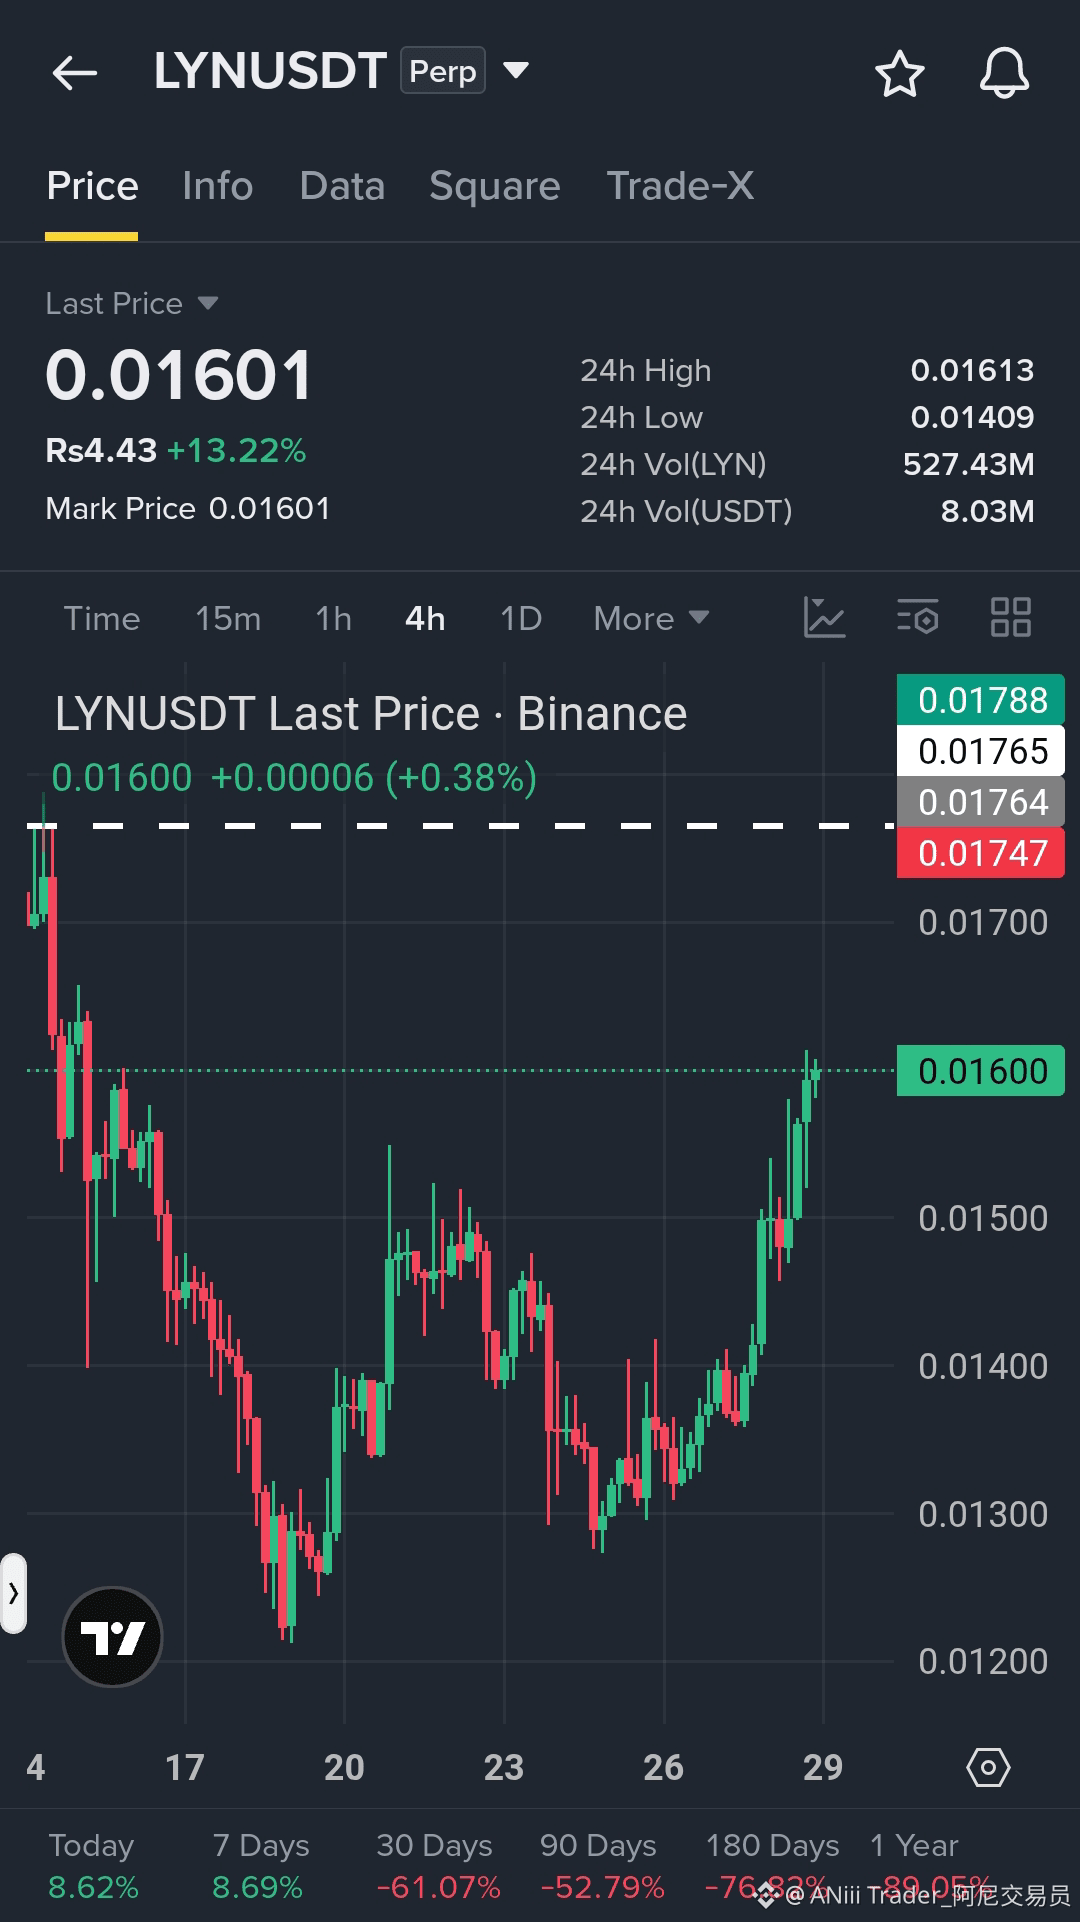
LYN is trading at 0.01601 with a +13.22% daily gain, forming a steady recovery leg on the 4-hour chart after bouncing from its local swing low near 0.01200 up to a 24h high of 0.01613. Price is pressing toward the key 0.01650–0.01700 resistance band, and buyers will need a confirmed candle hold above this area to sustain the upward shift.
{future}(LYNUSDT)
— ANiii Trader Analysis 📊
⚠️ High volatility near macro resistance levels; avoid chasing breakouts without proper confirmation. Not financial advice.
Do you think $LYN will break through the 0.0170 resistance to flip its broader 4h trend?
{future}(LYNUSDT)
$EVAA
{future}(EVAAUSDT)
$LYN Analysis — Recovery Bounce Testing Mid-Range Resistance
LYN is trading at 0.01601 with a +13.22% daily gain, forming a steady recovery leg on the 4-hour chart after bouncing from its local swing low near 0.01200 up to a 24h high of 0.01613. Price is pressing toward the key 0.01650–0.01700 resistance band, and buyers will need a confirmed candle hold above this area to sustain the upward shift.
— ANiii Trader Analysis 📊
⚠️ High volatility near macro resistance levels; avoid chasing breakouts without proper confirmation. Not financial advice.
Do you think $LYN will break through the 0.0170 resistance to flip its broader 4h trend?
$EVAA
793
🚨 $BLUR LONG — Reversal Recovery Attempt Testing Local Range
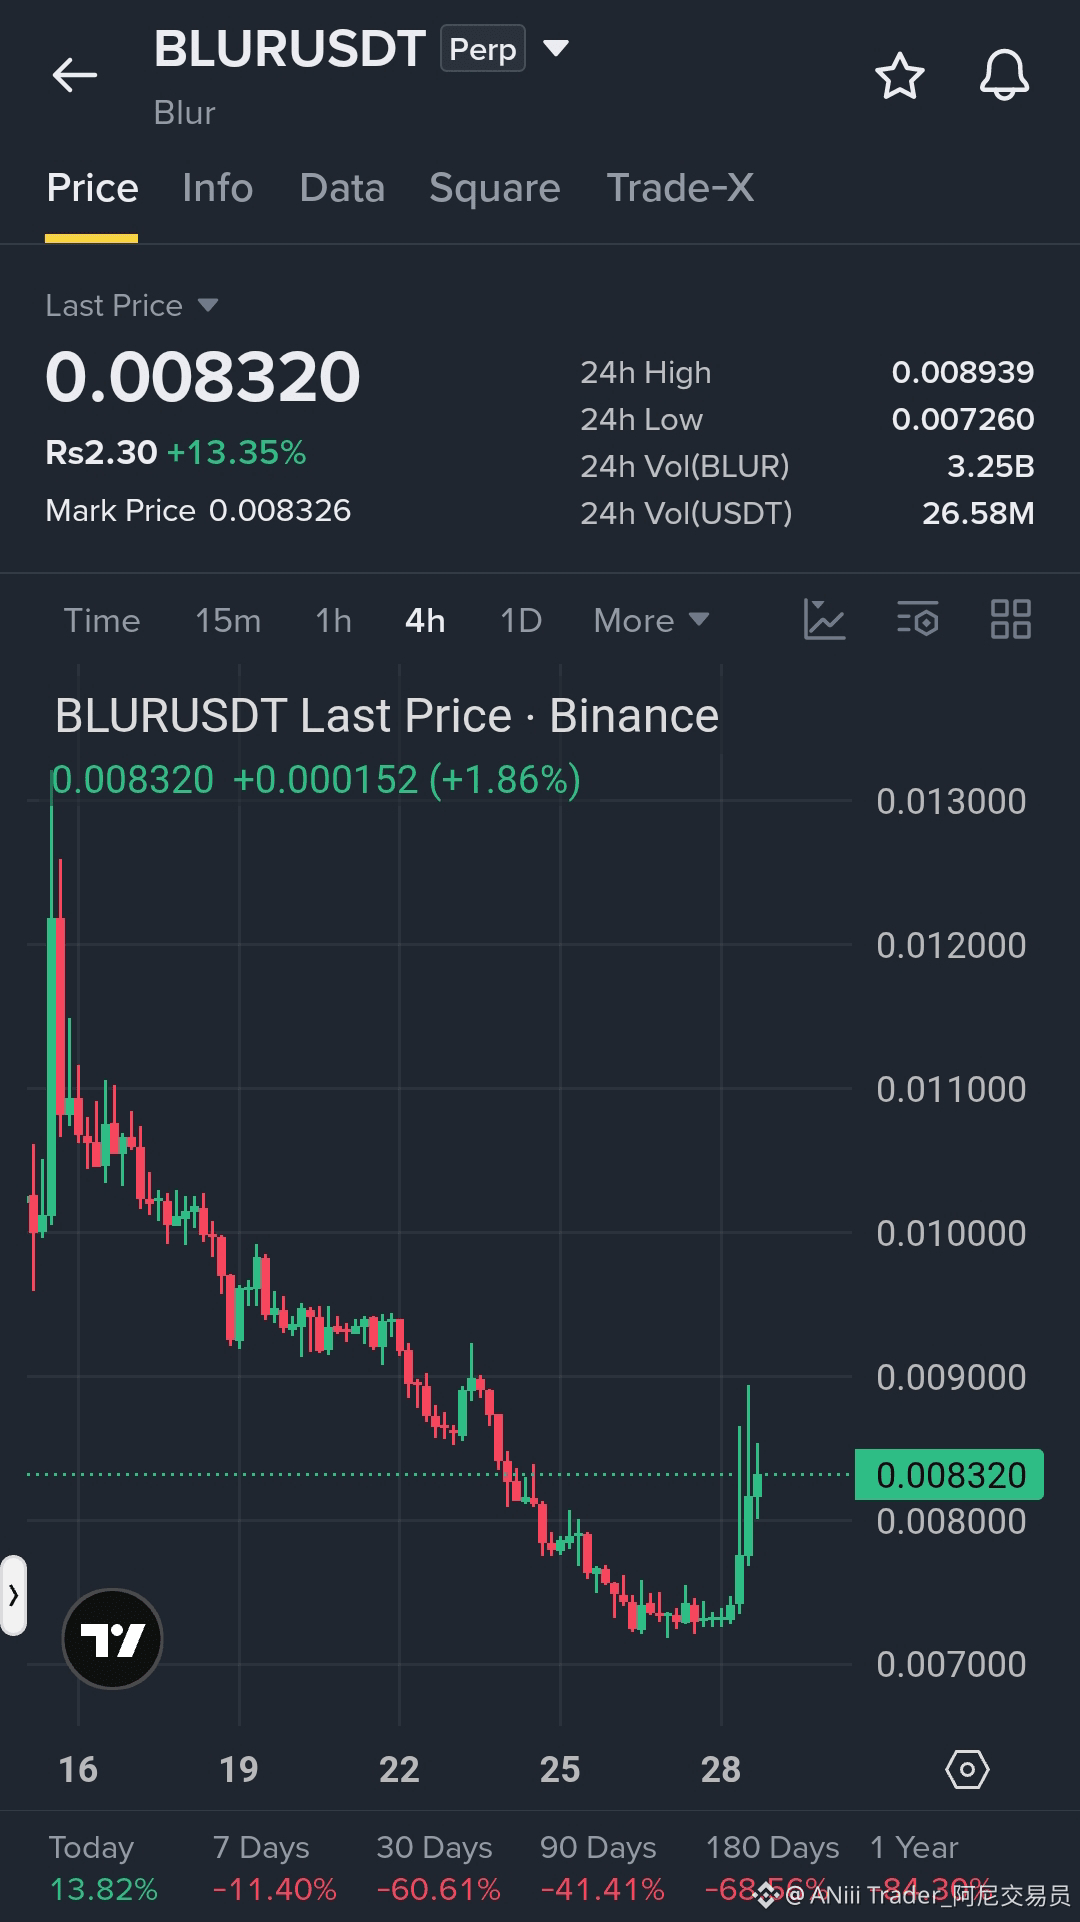
BLUR is trading at 0.008320 with a +13.35% daily gain, staging a strong recovery bounce on the 4-hour chart after defending the 0.007260 low up to a 24h high of 0.008939. I am watching for price to break and hold above the immediate 0.008500 resistance structure before considering a confirmed long entry.
— ANiii Trader Analysis 📊
📍 Entry: 0.008000 - 0.008350
🎯 TP1: 0.009000
🎯 TP2: 0.010000
🛑 SL: 0.007500
📊 R:R: 1:2.2
Setup: Reversal Attempt Base → Confirmed Break & Hold Above 0.0085 → Potential Long Recovery Leg
⚠️ Macro downtrend context still visible on higher timeframes; manage risk tightly against sudden rejections.
Do you think $BLUR will sustain this recovery leg and flip the broader 4h trend?
👇 Click to Open Trade
{spot}(BLURUSDT)
$EVAA
{future}(EVAAUSDT)
🚨 $BLUR LONG — Reversal Recovery Attempt Testing Local Range
BLUR is trading at 0.008320 with a +13.35% daily gain, staging a strong recovery bounce on the 4-hour chart after defending the 0.007260 low up to a 24h high of 0.008939. I am watching for price to break and hold above the immediate 0.008500 resistance structure before considering a confirmed long entry.
— ANiii Trader Analysis 📊
📍 Entry: 0.008000 - 0.008350
🎯 TP1: 0.009000
🎯 TP2: 0.010000
🛑 SL: 0.007500
📊 R:R: 1:2.2
Setup: Reversal Attempt Base → Confirmed Break & Hold Above 0.0085 → Potential Long Recovery Leg
⚠️ Macro downtrend context still visible on higher timeframes; manage risk tightly against sudden rejections.
Do you think $BLUR will sustain this recovery leg and flip the broader 4h trend?
👇 Click to Open Trade
$EVAA
330
$MU — Long Setup | Breakout Retest, Support Hold (1h)
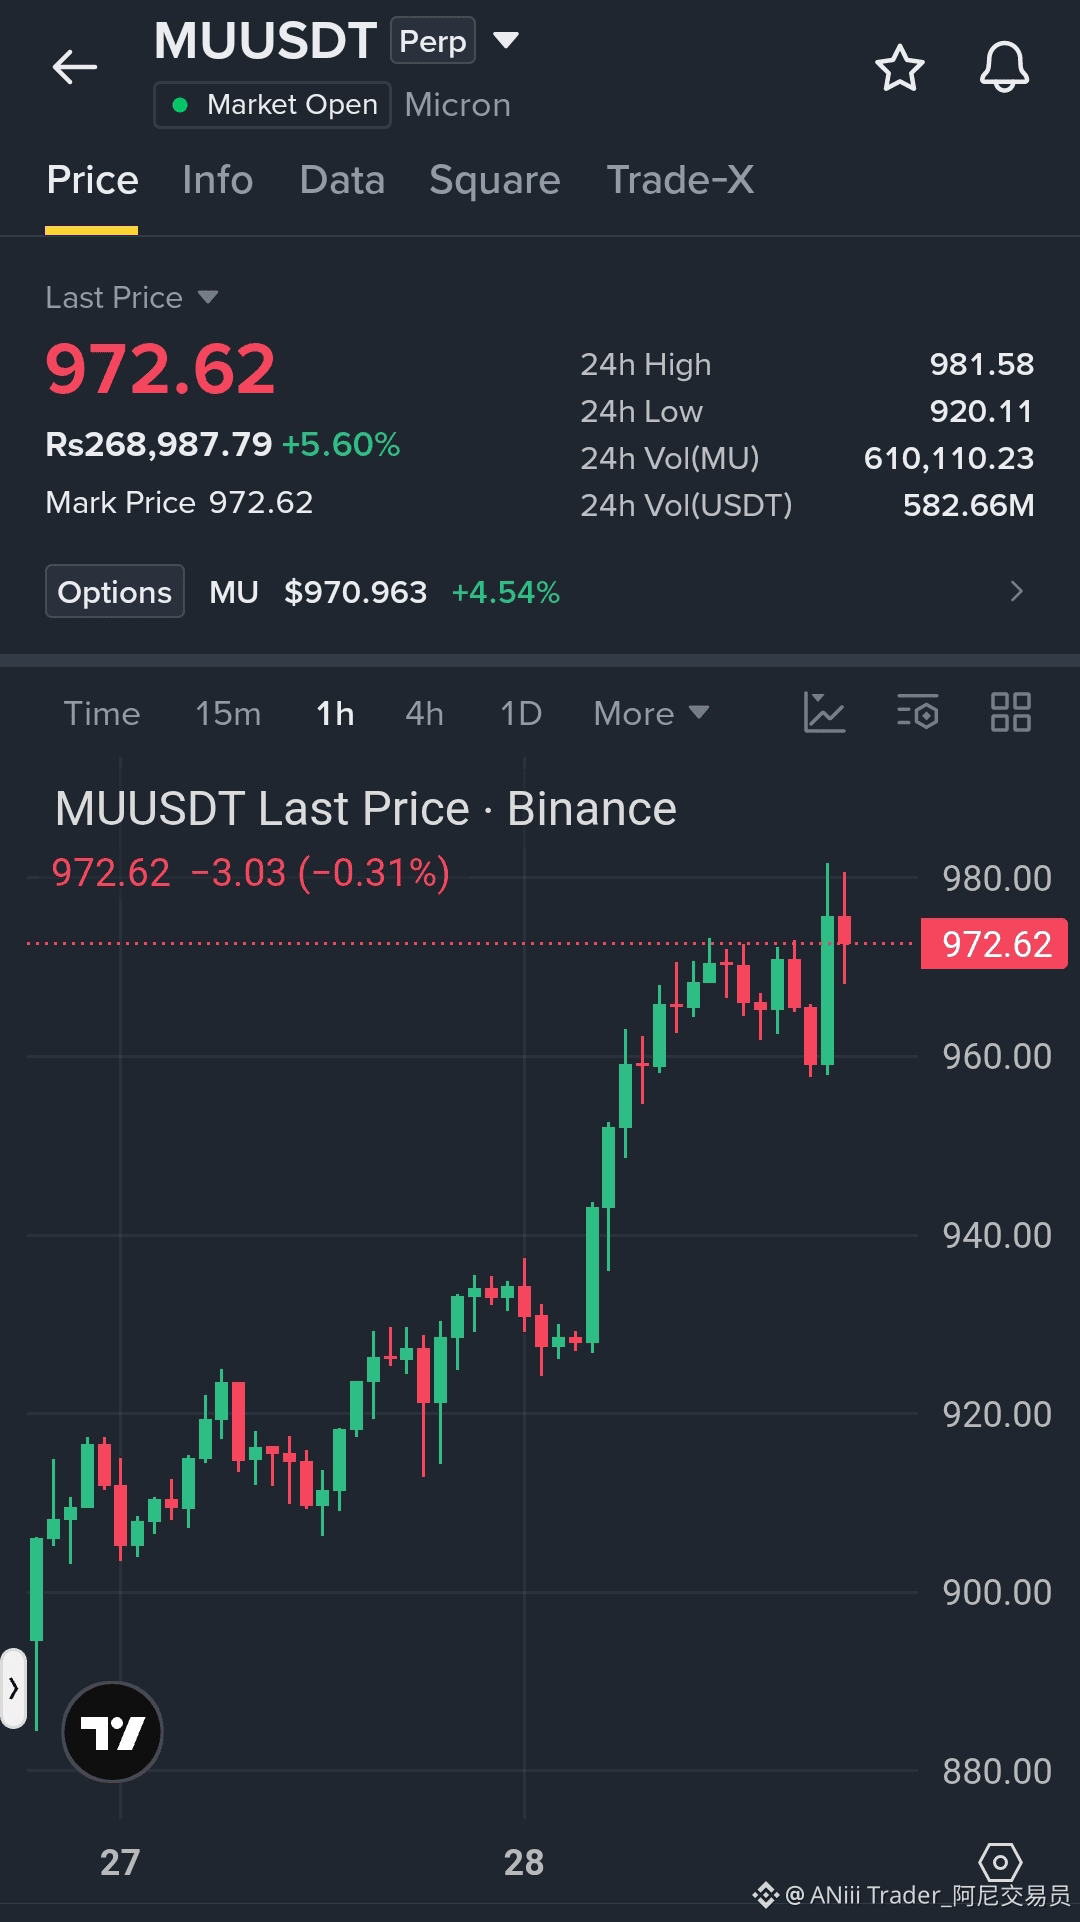
MU is up about 5.6% in 24h and trades near $972.62 on $583M in volume, after breaking out of a $962–$970 consolidation and printing a $981.58 high. The $958–$960 low from the latest dip is holding as support. A pullback into that retest zone is cleaner than buying near the high.
📍 Entry: $962.00–$968.00 (limit order on pullback)
🎯 TP1: $981.50
🎯 TP2: $1,000.00
🛑 SL: Below $956.00
Setup: Breakout + retest hold. If $956 breaks on a 1H close, skip the trade. A 1H close above $981.58 would show buyers still in control.
Do you think $MU holds the $960 zone, or fades from here? 👇
⚠️ Not financial advice. This is a stock perp, so prices can gap when the market closes. Use low leverage and strict risk management.
— ANiii Trader Analysis 📊
👇 Click to Open Trade
{future}(MUUSDT)
$EVAA
{future}(EVAAUSDT)
$MU — Long Setup | Breakout Retest, Support Hold (1h)
MU is up about 5.6% in 24h and trades near $972.62 on $583M in volume, after breaking out of a $962–$970 consolidation and printing a $981.58 high. The $958–$960 low from the latest dip is holding as support. A pullback into that retest zone is cleaner than buying near the high.
📍 Entry: $962.00–$968.00 (limit order on pullback)
🎯 TP1: $981.50
🎯 TP2: $1,000.00
🛑 SL: Below $956.00
Setup: Breakout + retest hold. If $956 breaks on a 1H close, skip the trade. A 1H close above $981.58 would show buyers still in control.
Do you think $MU holds the $960 zone, or fades from here? 👇
⚠️ Not financial advice. This is a stock perp, so prices can gap when the market closes. Use low leverage and strict risk management.
— ANiii Trader Analysis 📊
👇 Click to Open Trade
$EVAA
191
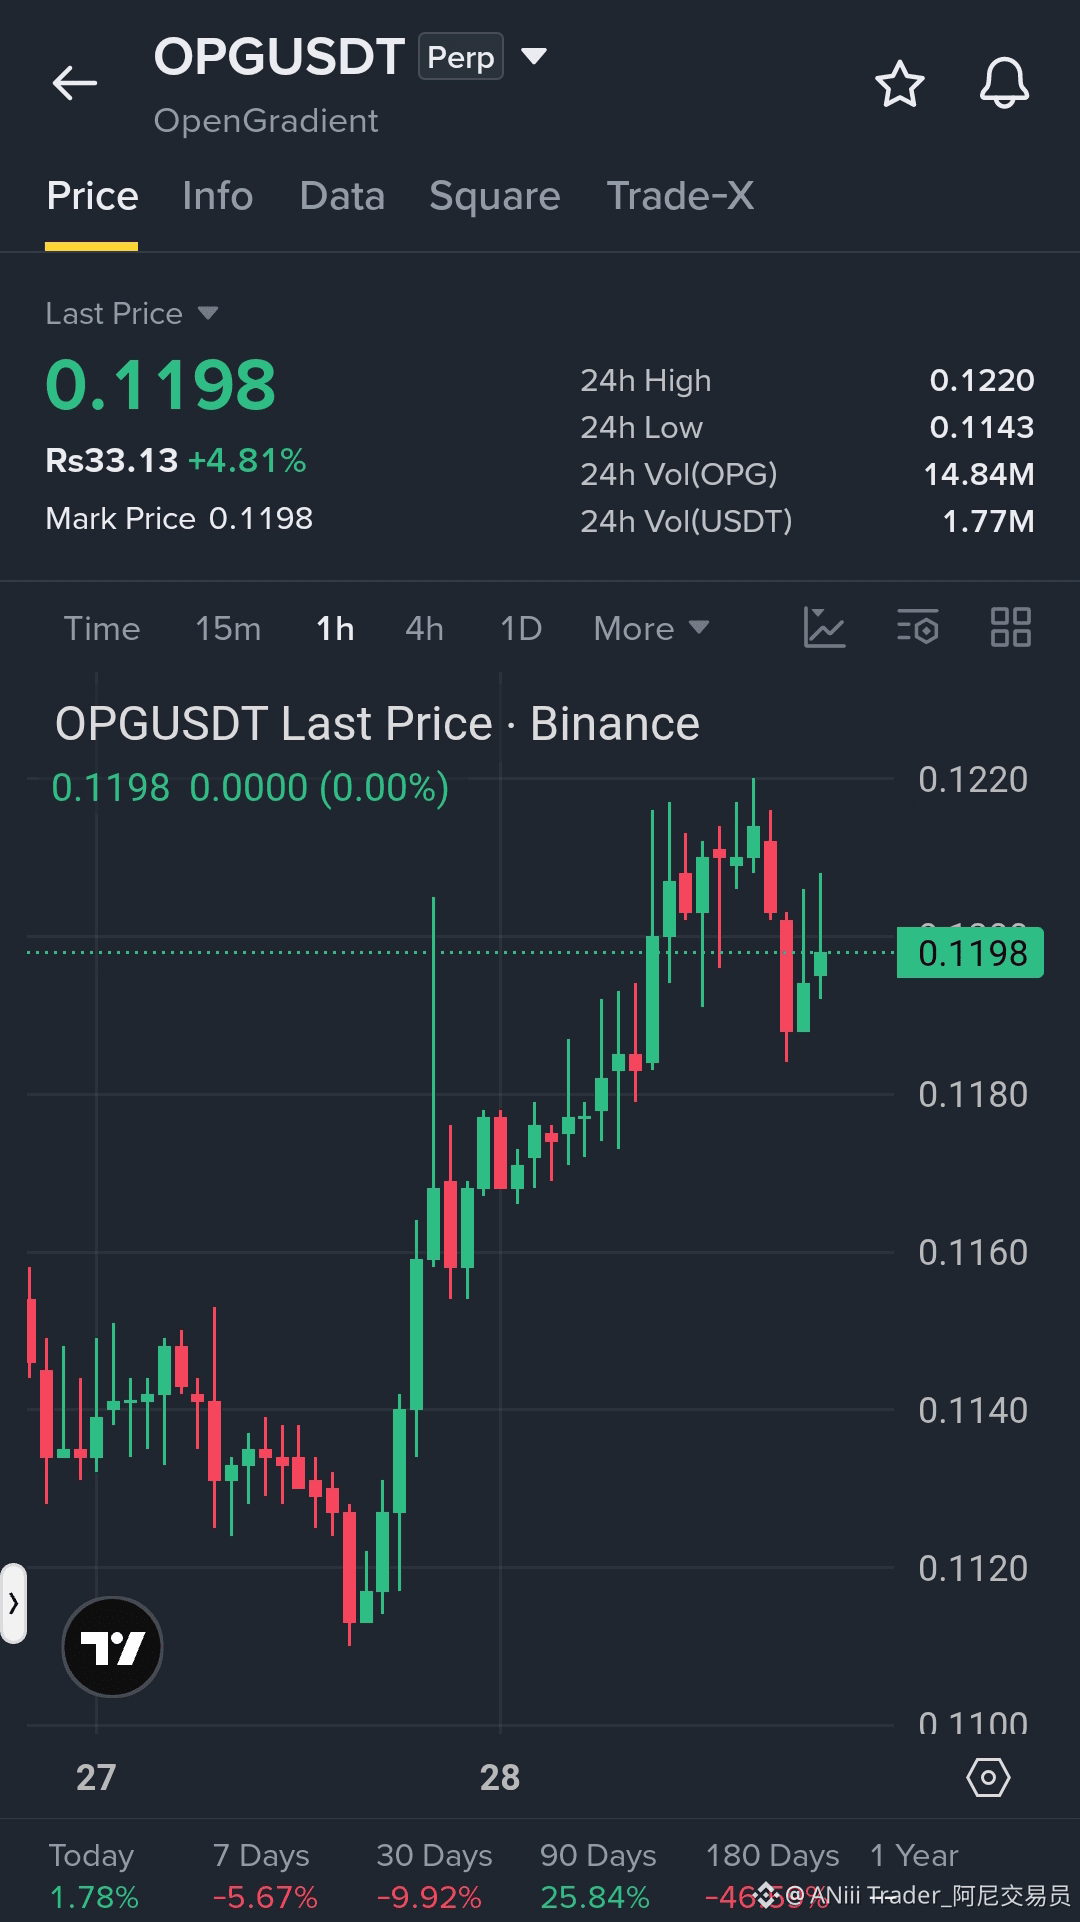
$OPG : Pressing Against $0.1220 on Thin Volume
OPG trades near $0.1198, up about 5% in 24h, after a steady run of higher lows into the $0.1220 high that was rejected on the 1h chart. I want a clean 1h close above $0.1220 before calling a breakout, while a break below $0.1180 would signal the push is fading. Volume is only about $1.8M, so moves can be exaggerated.
Does $OPG clear $0.1220, or slip back to $0.1180?
⚠️ Thin volume and a -47% move over 180 days mean sharp reversals are possible. Not financial advice.
— ANiii Trader Analysis 📊
👇 Trade on Binance
{spot}(OPGUSDT)
$EVAA
{future}(EVAAUSDT)
$OPG : Pressing Against $0.1220 on Thin Volume
OPG trades near $0.1198, up about 5% in 24h, after a steady run of higher lows into the $0.1220 high that was rejected on the 1h chart. I want a clean 1h close above $0.1220 before calling a breakout, while a break below $0.1180 would signal the push is fading. Volume is only about $1.8M, so moves can be exaggerated.
Does $OPG clear $0.1220, or slip back to $0.1180?
⚠️ Thin volume and a -47% move over 180 days mean sharp reversals are possible. Not financial advice.
— ANiii Trader Analysis 📊
👇 Trade on Binance
$EVAA
1
278
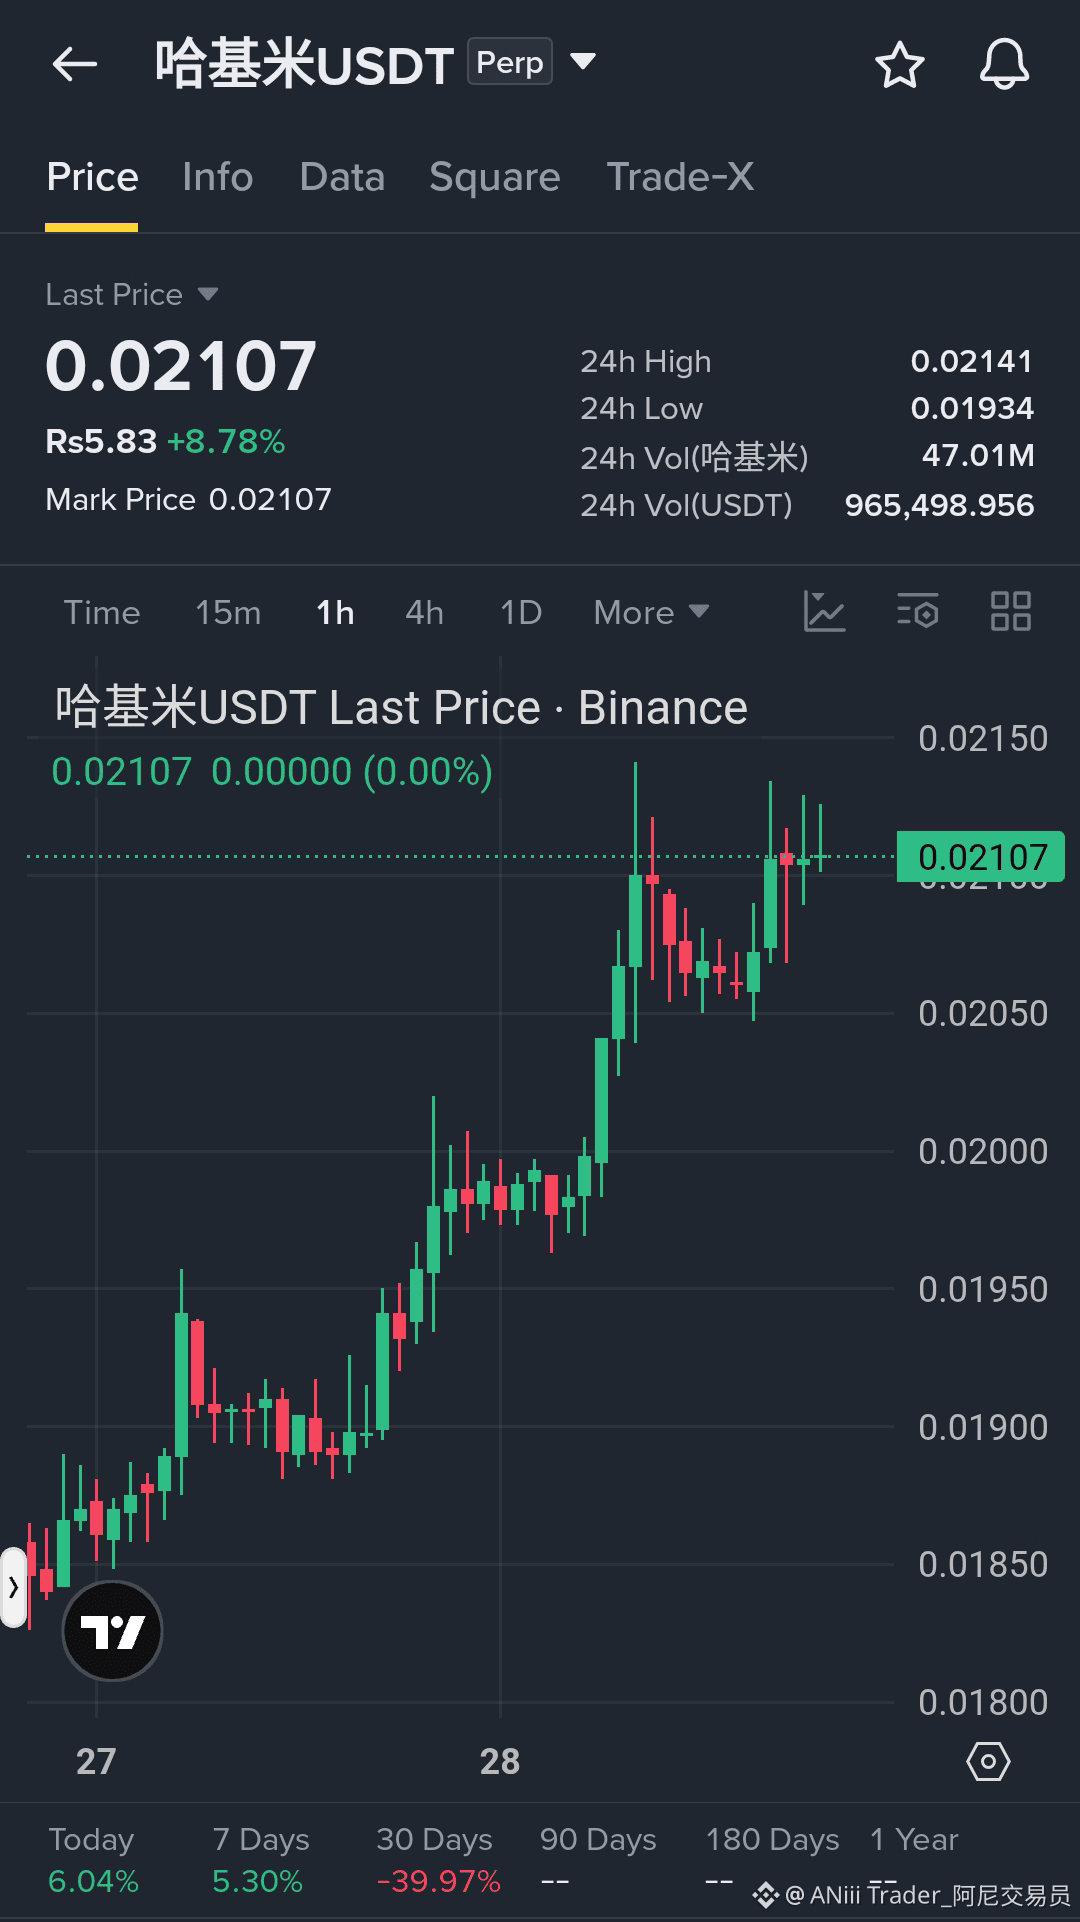
$哈基米 Grinding Into the 24h High
Hakimi trades near $0.02107, up about 9% in 24h, sitting just under its $0.02141 high after a staircase of higher lows on the 1h chart. $0.0205 is the first support, and I want a clean 1h close above $0.0214 before calling continuation, while a drop under $0.0205 would signal the climb is fading.
Is $哈基米 building a real trend, or just grinding into resistance?
⚠️ Volume is under $1M and the coin is down about 40% over 30 days, so moves can be exaggerated. Not financial advice.
— ANiii Trader Analysis 📊
👇 Trade on Binance
{future}(哈基米USDT)
$LAB
{future}(LABUSDT)
$哈基米 Grinding Into the 24h High
Hakimi trades near $0.02107, up about 9% in 24h, sitting just under its $0.02141 high after a staircase of higher lows on the 1h chart. $0.0205 is the first support, and I want a clean 1h close above $0.0214 before calling continuation, while a drop under $0.0205 would signal the climb is fading.
Is $哈基米 building a real trend, or just grinding into resistance?
⚠️ Volume is under $1M and the coin is down about 40% over 30 days, so moves can be exaggerated. Not financial advice.
— ANiii Trader Analysis 📊
👇 Trade on Binance
$LAB
249
Log in to explore more content
Join global crypto users on Binance Square
⚡️ Get latest and useful information about crypto.
💬 Trusted by the world’s largest crypto exchange.
👍 Discover real insights from verified creators.
Email / Phone number