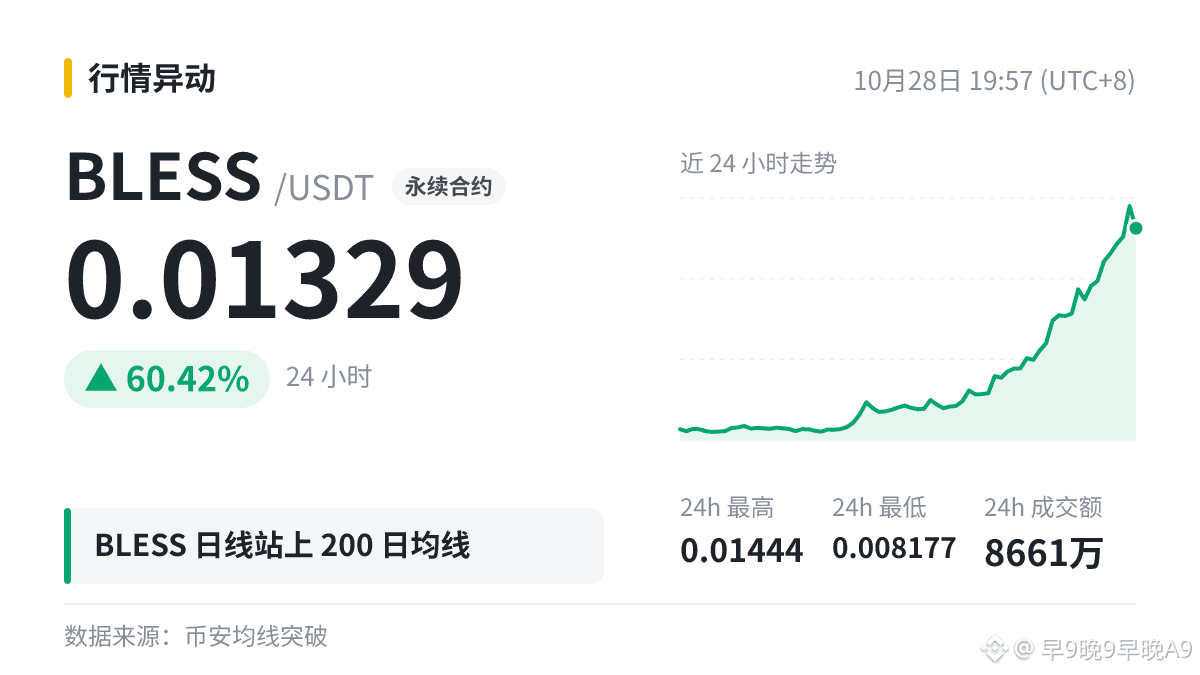
🐋 $BLESS closed above the MA200 on the daily chart (0.008351).
This is a moving average that many medium- to long-term investors watch, but first, understand what it is.
Moving averages are calculated from past prices, so they lag by nature: the longer the period, the smoother the average and the slower it is to turn.
An intraday cross and a daily close holding above it are two different things. It’s more convincing when the price remains on the other side of the average after the daily close.
Indicators can fail, so don’t skip your stop-loss: planning how to respond if your read is wrong matters more than guessing correctly.