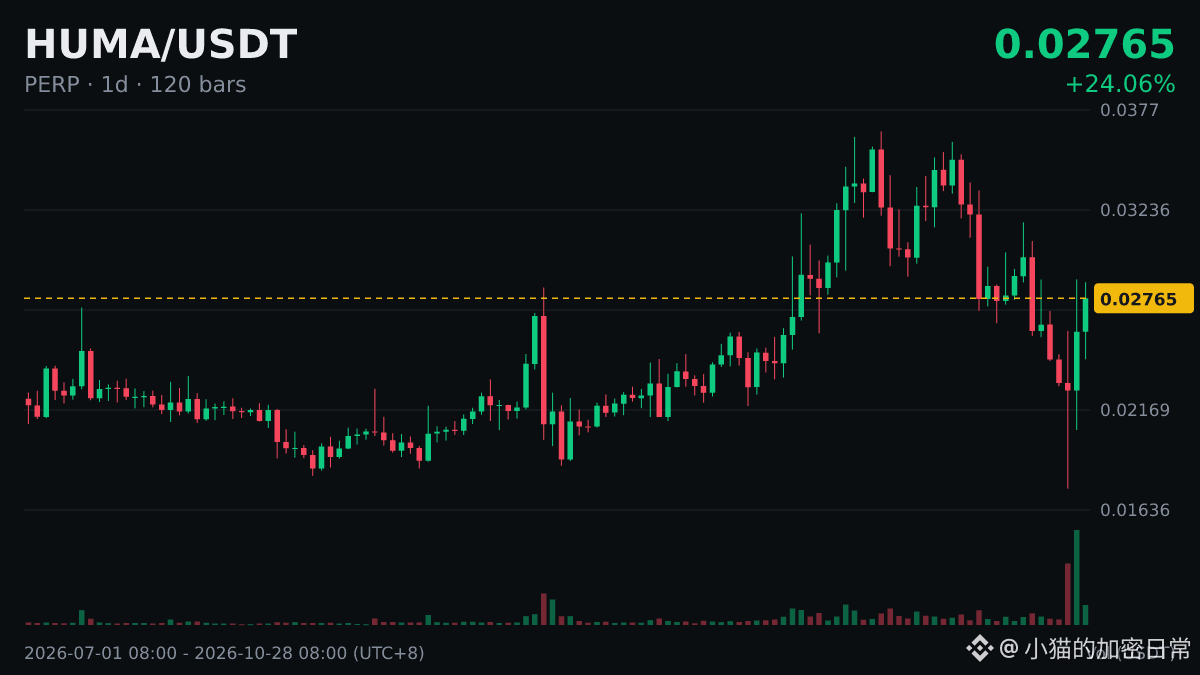
$HUMA The daily chart moved above MA50 (0.02787); the current price is 0.02769.
MA50 reflects the medium-term trend, but the price has now fallen back below the moving average. For now, this can only be considered a test—several consecutive candles closing above the moving average are needed to confirm a sustained move above it.
Is it a signal or just noise?
#HUMA
Just take a look—don’t buy based on this. Make your own decision.