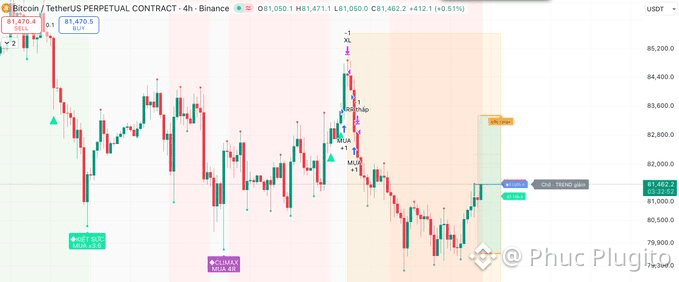
$BTC 15h30 28/10/2026 H4 chart: Strategy details around 82200
82200 is an important resistance zone on the 4-hour chart. This is where the bears previously showed strong short-side activity, with -1 XL and low -1 RR signals during the previous rebound.
If the price moves up to 82200:
The bulls need a strong increase in volume to break through. If a 4-hour candle closes above 82200–82400, the price could extend to 82800–83200.
If the price touches 82200 and gets pushed back (especially with rising selling volume), the bears have the advantage. The nearest target is 81400–81000, with a further target of 79900–79300.
Specific strategies:
Long: Enter only if the price breaks above 82200 and holds there with volume. Stop below 81800–81600. First target 82800, further target 83400–84000.
Short: Watch for a retest of 82200 that fails to break through, or a strong selling signal. Stop above 82600–82800. First target 81000, next target 79900.
The current risk/reward around this zone is not very attractive for an early entry, as the price is around 81462 and still about 740 points away from 82200.
The price is still below 82200 and awaiting confirmation. A break above 82200 would give the bulls a short-term advantage. If it fails to break through, the bears will remain in control. Is your trading strategy similar to mine?