

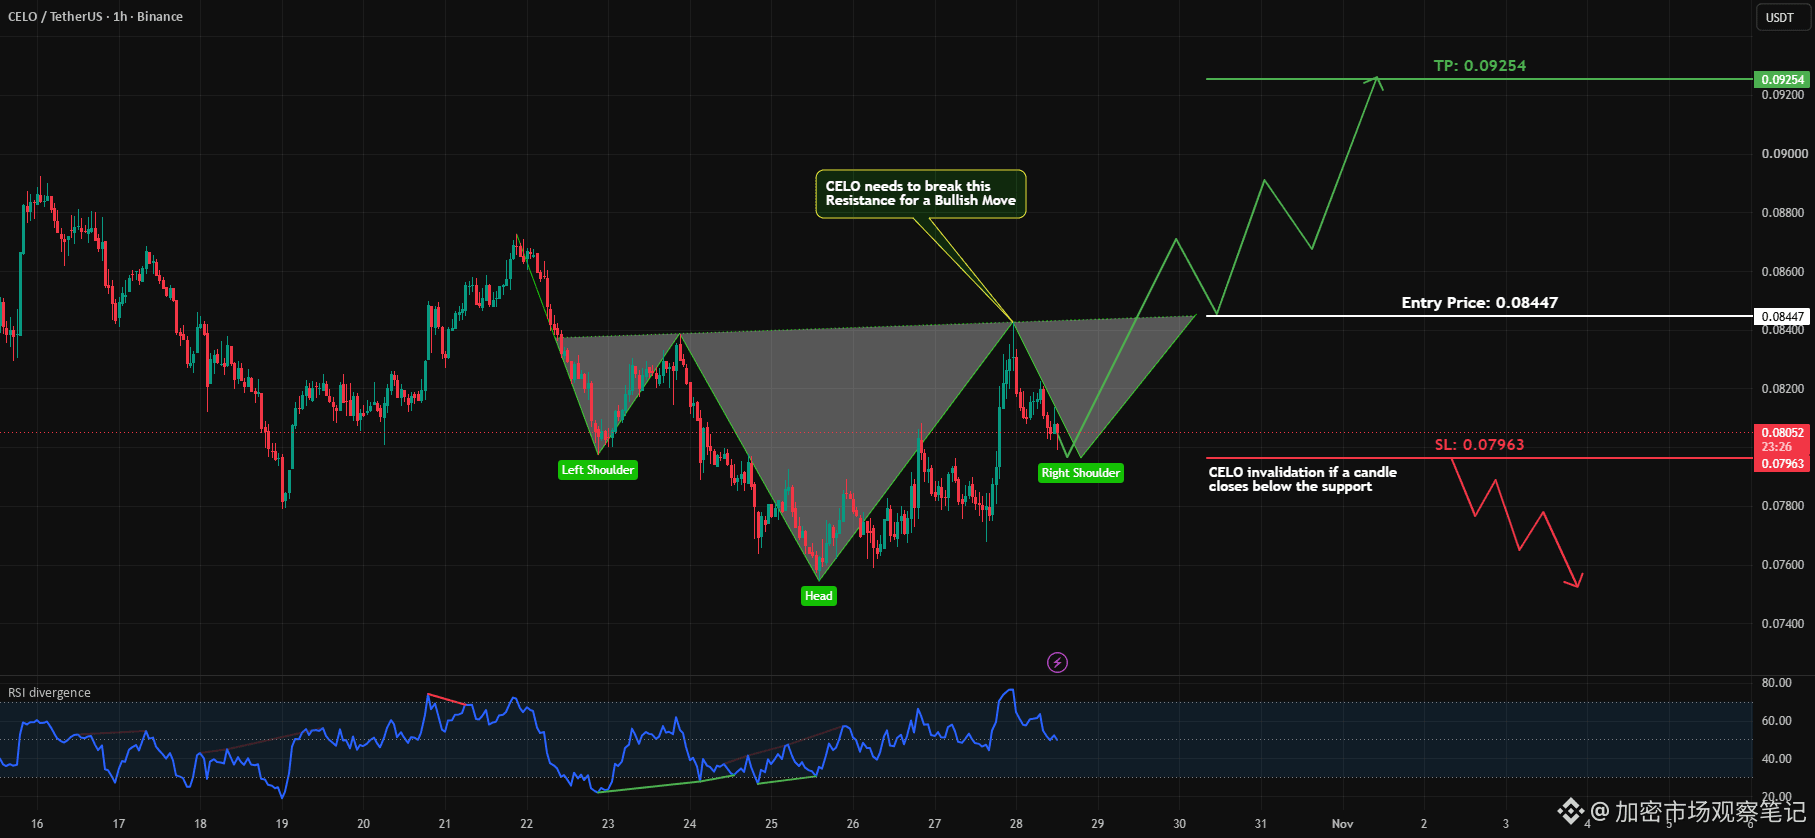
Things are getting interesting! CELOUSDT’s 1-hour bullish breakout analysis has already sketched out a potential reversal scenario, which is certainly a little surprising: In a post published on October 28, 2026, the author said CELOUSDT was forming an “inverse head and shoulders” pattern alongside a double bullish divergence. This could indicate improving bullish momentum, with a trend reversal potentially in the making. The original post did not provide specific price data.\n\nIn this analysis, the neckline is the key confirmation level. The author did not enter early, but instead plans to consider going long only after the price confirms a breakout above the neckline. If a breakout does occur, it should still be paired with an appropriate entry signal, with stop-loss and take-profit levels set according to the chart structure and risk-reward ratio. “Bullish” here is simply the author’s interpretation of the chart pattern, not a market fact that has already occurred.\n\nThe caveat is clear: until the neckline is decisively broken, this remains only a potential bullish pattern; if the breakout fails, the entire pattern may be invalidated. In other words, the double divergence and inverse head and shoulders make the setup worth watching, but they do not, on their own, prove that a trend reversal is certain.\n\nFor CELO traders, the current impact is more neutral, since the original post did not confirm a breakout or provide an actual price target. If the neckline breakout the author is waiting for occurs, one might infer that market attention and bullish expectations could increase. But before confirmation, treating it as a definitive bullish signal would not be consistent with the conditions in the original post. Do you think bulls can break through the neckline, or will sellers continue to hold the resistance?\nSource: TradingView Crypto Ideas\n\nSource: TradingView Crypto Ideas

Join global crypto users on Binance Square
⚡️ Get latest and useful information about crypto.
💬 Trusted by the world’s largest crypto exchange.
👍 Discover real insights from verified creators.
Email / Phone number