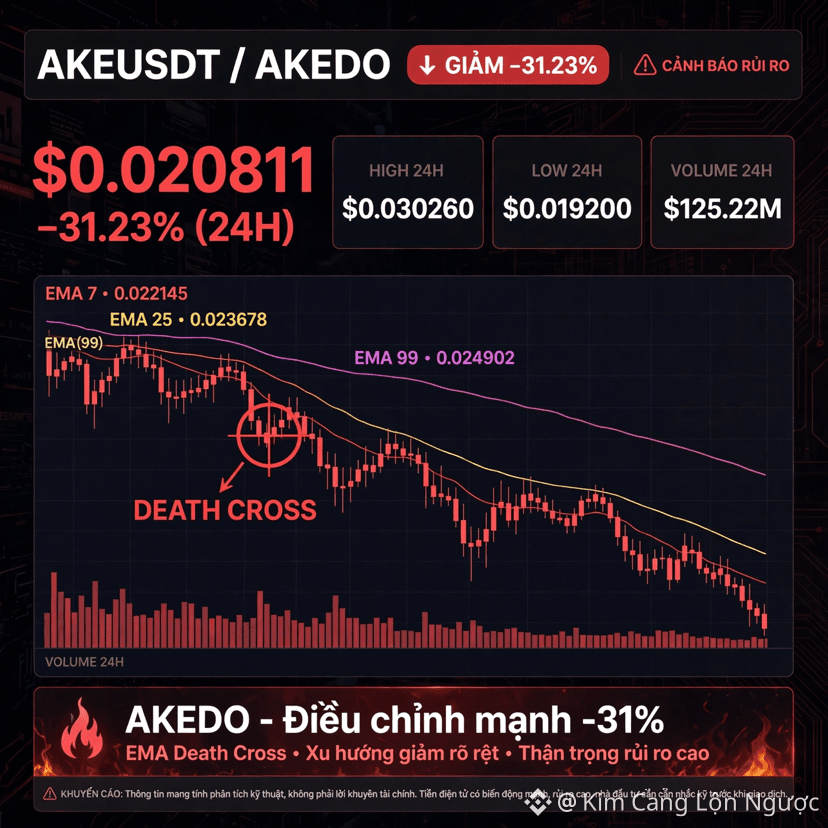
📉 $AKE USDT DOWN SHARPLY -31.23% IN 24H - RISK SIGNAL 📉
AKEDO is undergoing a deep correction after reaching a high of $0.0405. Selling pressure is dominant.
PROFESSIONAL TECHNICAL INDICATORS
Current price: $0.020811 | -31.23% in 24h
EMA Death Cross: EMA(7) 0.021817 < EMA(25) 0.024310 < EMA(99) 0.028425 = Downtrend is dominant
24h volume: 5.27B AKE ≈ $125.22M USDT
24h High/Low: $0.030260 / $0.019200 | The low has been tested
Long/Short ratio: 24.29% Long / 75.71% Short = Shorts are dominant
Performance: 7 days -33.41% | 30 days -36.32% | 180 days +6,035.95%
SCIENTIFIC ANALYSIS
1. Price structure: Broke below EMA(7) and EMA(25) on the 1h and 4h timeframes. Long-bodied red candles with high volume confirm active selling pressure.
2. EMA: EMA(7) crossed below EMA(25), forming a Death Cross. Price is below all 3 EMA lines → a clear downtrend.
3. Key levels: Nearby support at $0.0192 - $0.020. If it breaks below, the next level is $0.0185. Resistance: $0.0228 - $0.0243, the EMA(7) and EMA(25) zone.
4. Sentiment: The Long/Short ratio is heavily skewed toward Shorts at 75.71%, but oversold conditions could trigger a short squeeze and a technical rebound.
⚠️ Warning: Volatility is very high. The 180-day figure is still +6,035%, showing that the price had surged sharply beforehand. Manage your capital carefully. Do not FOMO into buying the dip.