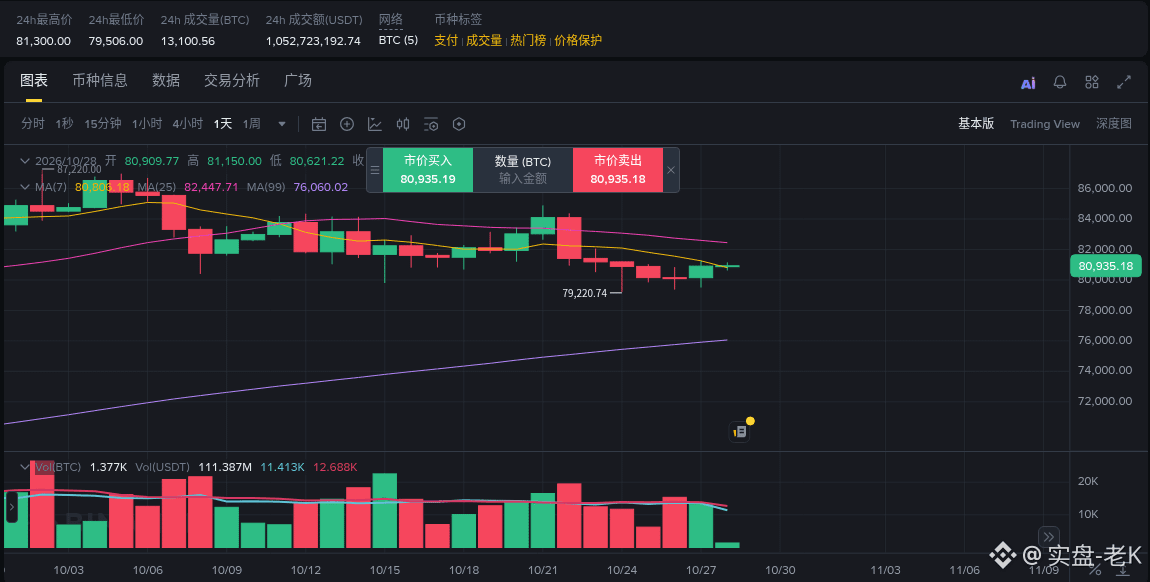
Each of the three tests of the lows was higher than the last, and Bitcoin has reclaimed the top of the range (1/5)
On the 24th, 26th, and 27th, Bitcoin tested the lows three times, each time higher than before. The lowest test was near $79,200.
Earlier, on the 21st, it surged to nearly $85,000. The next day, a large bearish candle on heavy volume sent prices tumbling—the highest trading volume of this entire stretch. The market spent the following week digesting that candle.
The turn came yesterday evening. It hit its low at 6 p.m., started moving up at 8 p.m., and the 11 p.m. hour saw the highest volume of the day. Overnight, the price climbed back above the top of the range.
That said, yesterday’s daily candle was only a small bullish one, with volume about in line with the 20-day average. It wasn’t a high-volume reclaim.
The 20-day and 50-day moving averages are overhead, both around $82,000 and almost overlapping. Since the 21st, every rebound has stalled below them.
The 100-day and 200-day moving averages are still much farther below. The medium-term structure remains intact, so I’m not worried about that.
For now, I see this as a rebound within the range. My view won’t change until the daily close gets back above $82,000.
The candles from the past few days are all clustered in the upper half of the range, but the ceiling overhead hasn’t been broken yet.
$BTC
The above is only my personal view and does not constitute investment advice.