😤 The trend is bearish, yet somehow I’m looking for a long.
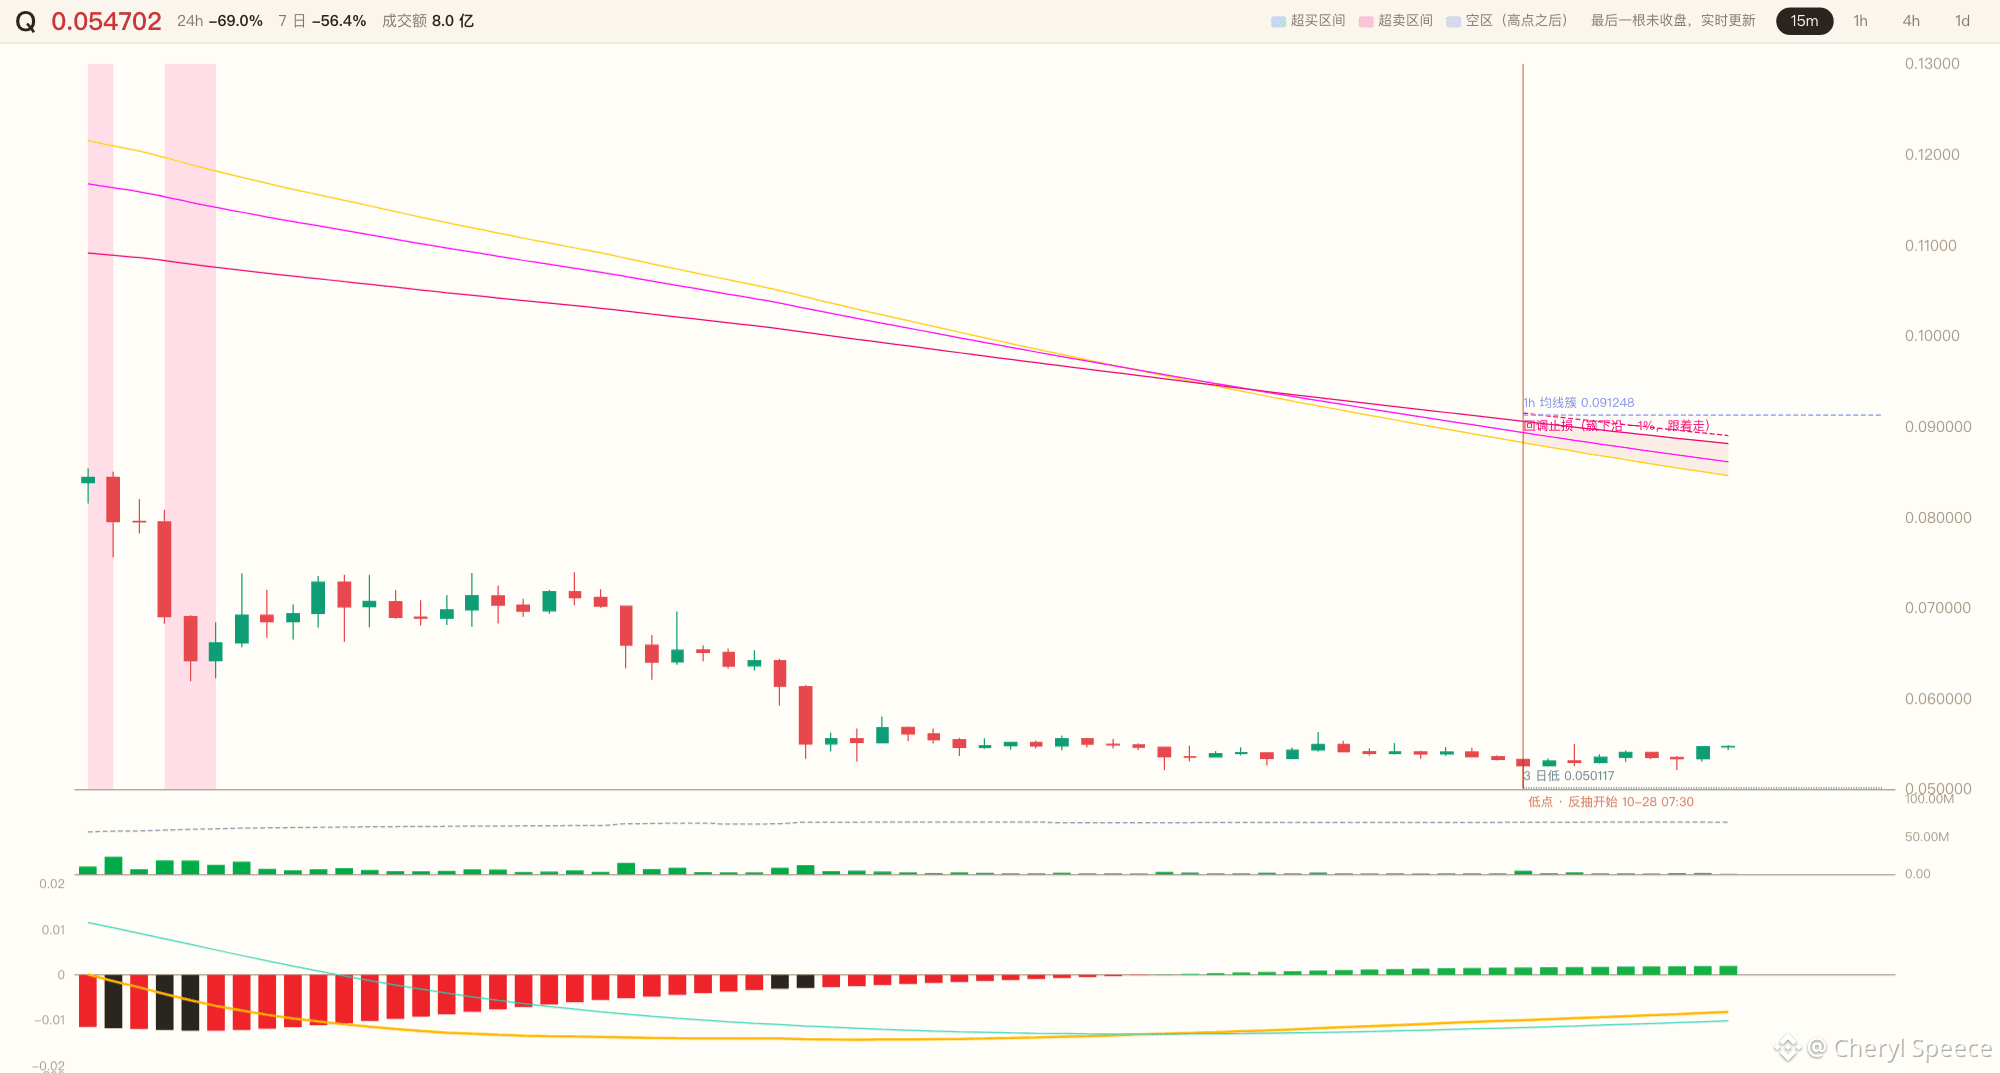
$Q 15m closed at 0.054666, 35.7% below the moving-average cluster. Over the last 96 candles, it bottomed at a 47.29% deviation. From that low, price has climbed 11 points.
🔥 It was oversold 33 candles ago, with a low of 0.053021. It hasn’t broken below that level since.
That matters more than any indicator.
😳 The MACD histogram has turned positive at 0.00193. Price is no longer oversold, and RSI is at 36.9. The sell-off has gone far enough; price is starting to catch its breath.
But the 1h moving averages are still tangled, and the 4h price has already fallen below the bullish cluster. This isn’t a reversal—it’s a bounce within a bearish trend.
👀 I’m not chasing the current price. I’ll only place an order at the bottom.
Entry at 0.053021, stop-loss at 0.048779 (-8.0%). If it doesn’t fill within 20 15m candles, I’ll cancel it.
The current price of 0.054666 is the dividing line—is this the start of an oversold recovery, or just a pause before the bears make their next move?
Here are the three charts. Are you betting it will retest 0.053021, hold, and bounce—or will the price first get pushed down further from this 35.7% deviation? Pick a side in the comments.
#ETH #BTC $ETH $BTC