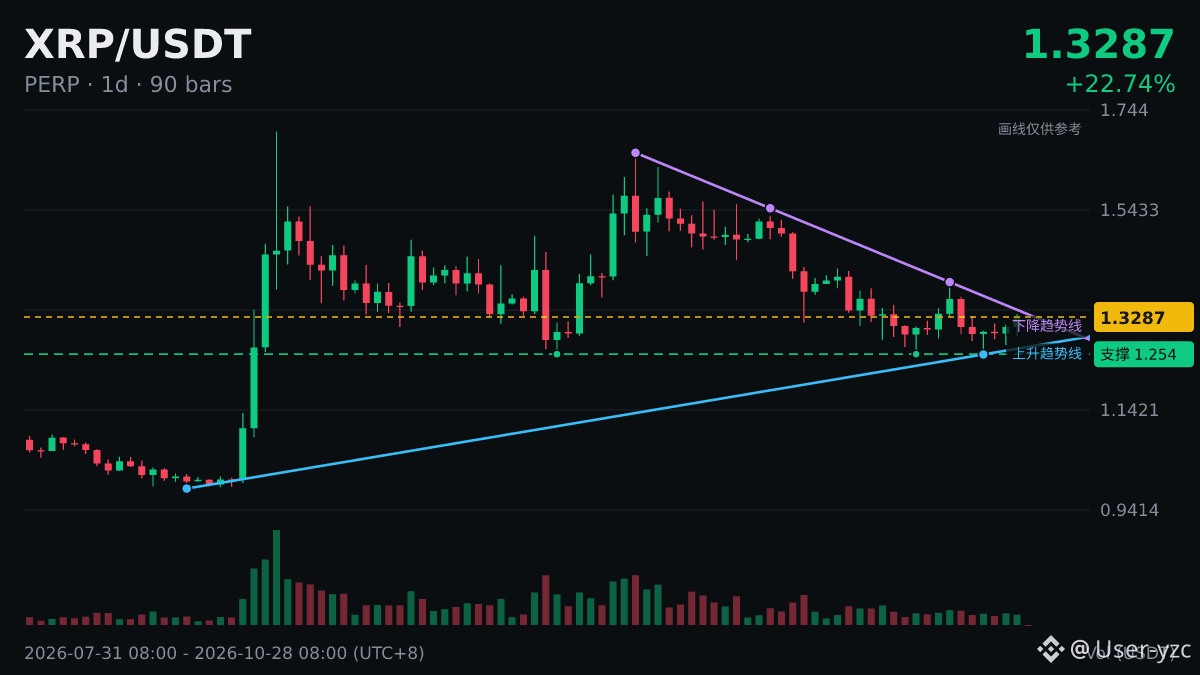
Came across this during my lunch break: $XRP The daily MACD formed a golden cross below the zero line, after 27 consecutive opposing histogram bars before the crossover.
When the fast and slow lines meet, my hands start itching to trade—but luckily, I checked the definition first.
A quick educational note: even with the same MACD settings, the meaning can vary quite a bit across timeframes. Crossovers happen more often on the 4-hour chart and less often on longer timeframes, but they carry more weight.
Cross-checking multiple data points is more reliable than looking at just one, but even more signals can't give you a definitive answer.
#XRP
Use this as a reference only; you’re responsible for your own profits and losses.