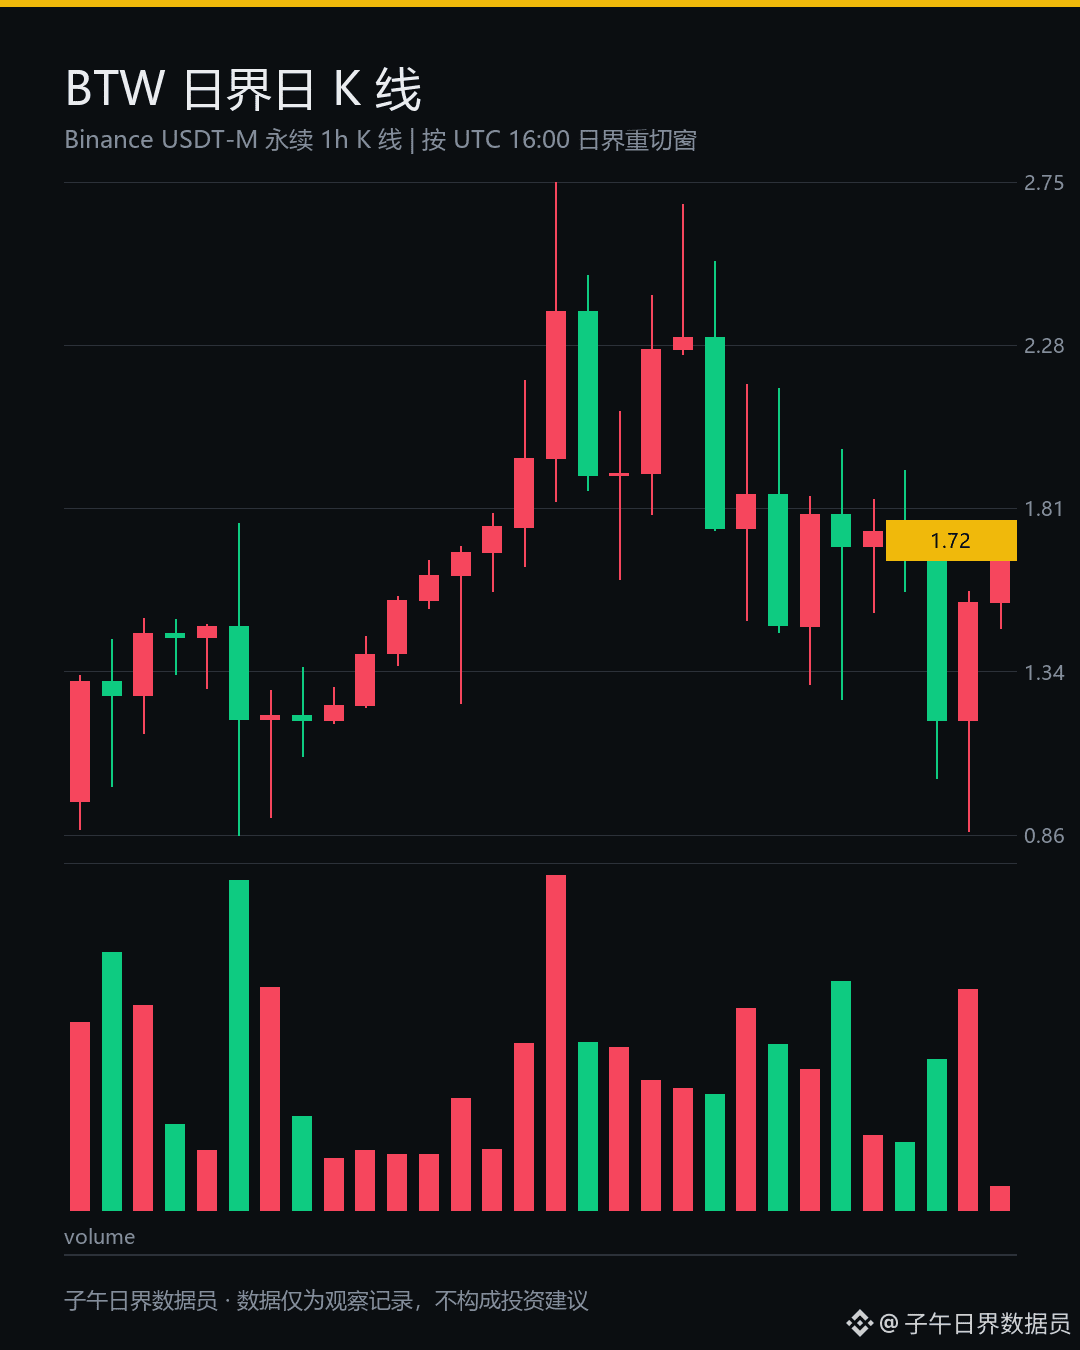
Everyone, the daily candle just rolled over, and I’ve been watching $BTW ’s chart for ages.
Up 53.931%.
The 24-hour range stretched to 56.950%, with a high of 1.7919 and the current price at 1.7582—just 1.881% off the high. Looks like it’s about to take off.
At first glance, I thought I’d read it wrong. I checked twice before believing it.
It’s still down 13.824% over the past 7 days and down 27.961% over the past 10 days. This big green candle bounced from the 48.483th percentile of the 10-day range,
while the 2.6888 resistance overhead is still holding firm. The bagholders up there are like a reservoir hanging in the balance.
There are only so many plates to go around; whoever’s closest to the pot gets served first. $BTC hasn’t caught up at all, yet money is still willing to rush into a small-cap like this.
That’s existing capital changing positions, not fresh money entering the market.
On the perpetuals order book, trading volume was 128.4 million USDT across 2,997,093 trades.
17 of the past 24 hourly candles closed green. Trade count is piling up much faster than volume.
When I look at rebounds like this on the right side of the chart, I never start with the percentage gain. I first look for where the trapped holders are. The more急ly a green candle shoots up, the harder it is to absorb the supply above.
The funding rate is just 0.005%—positive, but nowhere near overheated. Leverage hasn’t piled in yet, which suggests spot buying is driving the move.
My approach is to keep it on the watchlist. There’s trapped supply to chew through above, and a liquidity vacuum below. In a spot like this, neither bulls nor bears are being rational.
The food’s still hot—don’t rush to grab your chopsticks.
What do you think this move is: rotation or a shakeout? Let’s discuss in the comments.
$ETH
#BTW #比特币 #Crypto
The above is a record of my personal trading system and observations of market data; it does not constitute investment advice.