【$AVAX Breaking News Draws Attention—Is a Bullish Structure Taking Shape? $AVAX Technical Analysis】
【Hot Topic】
I just came across this news and immediately pulled up the AVAXUSDT chart to compare.
“Avalanche tokenized Treasuries gain yield-bearing collateral use” — Crypto.News reports that Lynq and ZeroBeta have connected institutional borrowing and trading margin to tokenized U.S.
The news is a catalyst; ultimately, price action still depends on the interplay between positioning and volume.
【Market Snapshot】
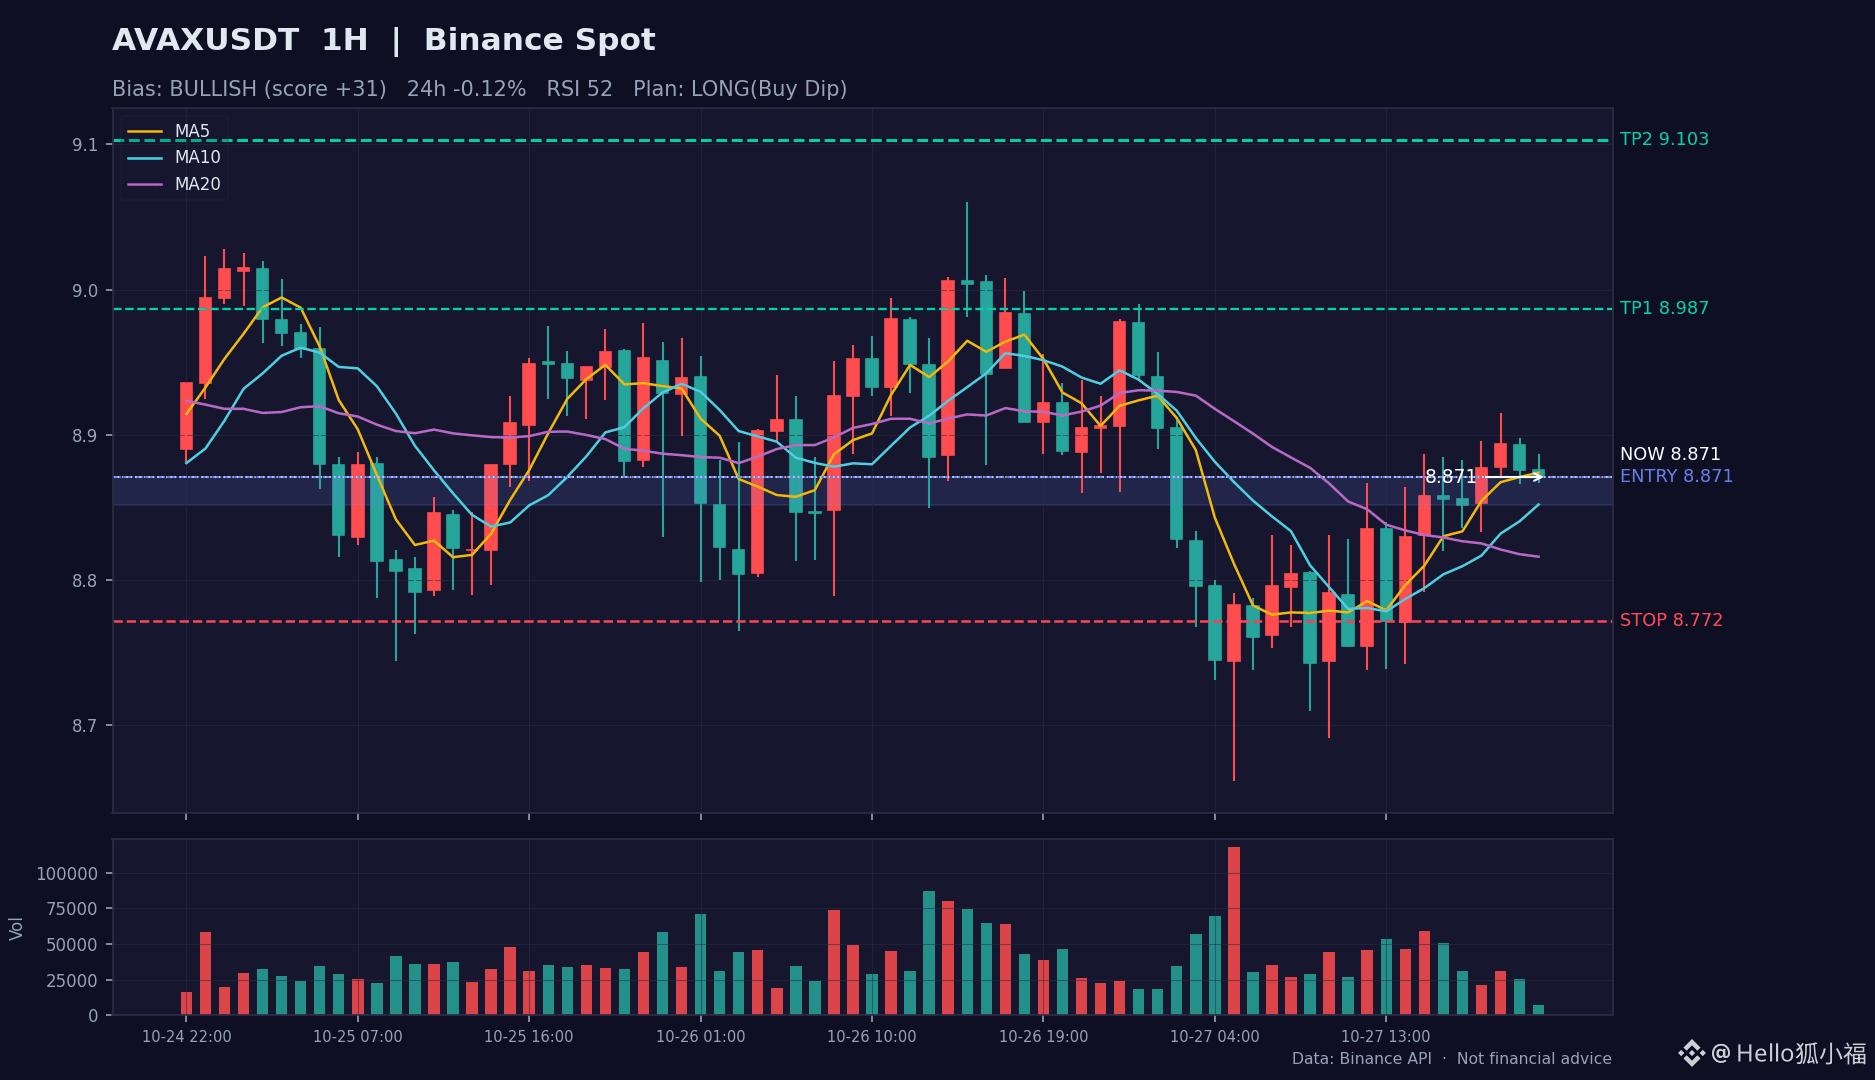
$AVAX is currently at 8.871, down 0.12% over 24 hours, with 24-hour trading volume of approximately 8.4M USDT.
【Technical Analysis】
· Moving averages: Short-term moving averages have formed a bullish crossover, and the price has moved back above MA20. The trend is recovering, but MA60 has yet to be reclaimed.
· Momentum: The MACD fast line is above the zero line, with red bars dominant, indicating that bullish momentum is continuing. RSI (52) is neutral to slightly weak, with bulls and bears still in a tug-of-war.
· Structure: The price is moving around the Bollinger middle band, and whether it holds or loses this level will determine the short-term pace. Volume is contracting (0.2 times the average), so directional signals should be treated with caution in these low-volume conditions.
【Directional View】
Overall score: 31/100. Structure is bullish: moving averages and momentum indicators are aligned to the upside. As long as a pullback holds above the lower boundary of the entry zone, I favor scaling in on dips. A break above the previous high could put the second target in reach; a high-volume break below the stop-loss level would invalidate this view.
【参考交易计划】
· Strategy: Buy dips
· Entry zone: 8.852 ~ 8.871
· Take profit: First target 8.987, second target 9.103
· Stop loss: 8.772
· Position size: Small position, 5%-10%; strictly exit if the stop-loss level is breached.
· Chart: The candlestick analysis chart is included in the post (1-hour chart, red for up and green for down; the entry zone/take-profit/stop-loss levels are marked with colored lines).
【Risk Warning】Data reflects probabilities, not a script. If any planned level is breached, exit first and reassess the rationale.
The above is solely my personal review and technical analysis, and does not constitute investment advice. DYOR.
$AVAX #AVAX #加密货币 #Market Analysis