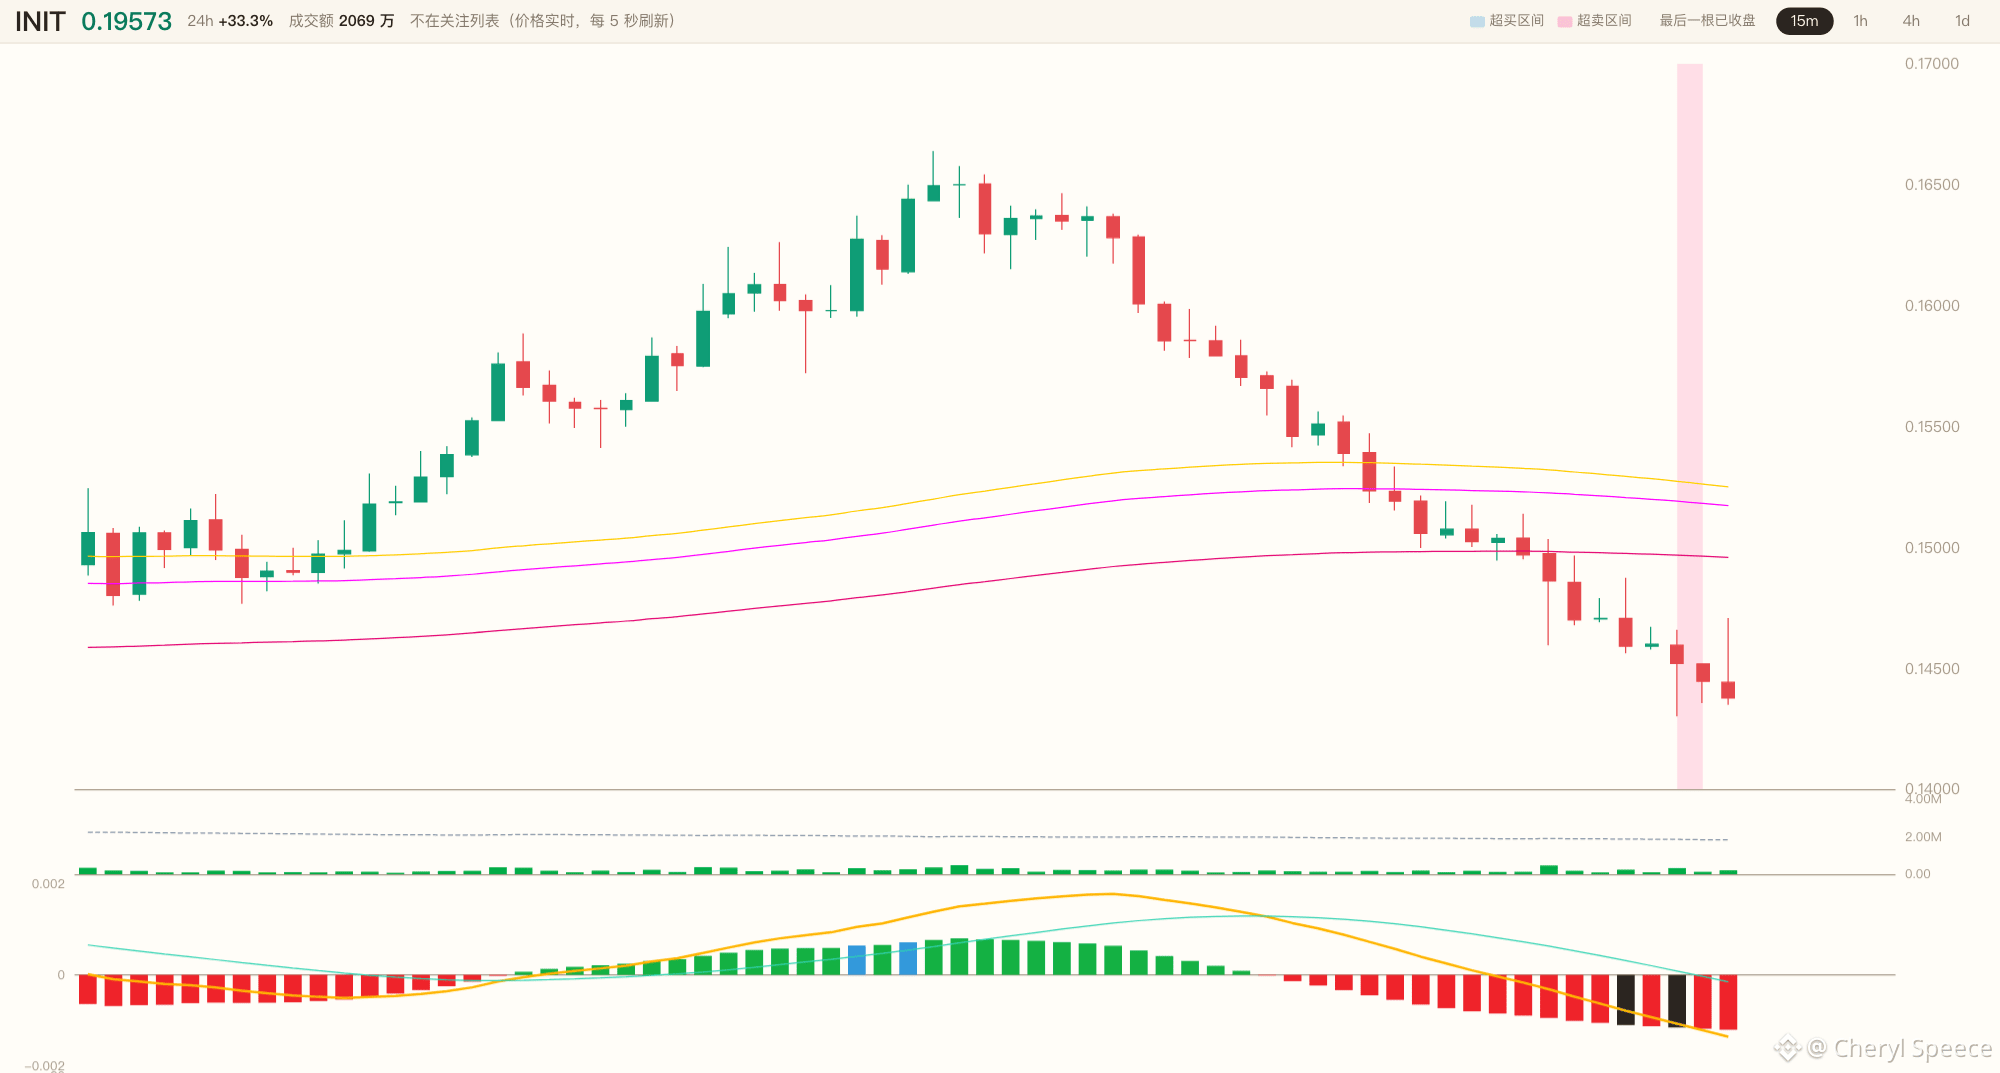
😤 28.0x volume. One 15m candle blasted straight through the previous 12-hour high of 0.18339, with $INIT closing at 0.19247—right at the 92% mark of the event candle.
🔥 Multiple timeframes are indeed nodding along: 19 bullish, 1 bearish, with both the 1h and 4h above the cluster.
😳 But I looked down at my feet and got chills—the upper edge of the moving-average cluster is at 0.15817, a full +21.68% away. This isn’t standing on solid ground; it’s hanging in midair.
RSI 79.0, CCI 411. Conditions: 3 / 6, and all three failed signals are clustered around overbought conditions.
😤 And that’s not even mentioning BTC and ETH both leaning bearish. The door for altcoin longs isn’t even open; the 1d is still bouncing within a downtrend. This isn’t going with the trend—it’s the bulls setting off a string of firecrackers in someone else’s yard.
👀 I’m not chasing. I’ll wait.
I’ll wait for a pullback to the upper edge of the moving-average cluster at 0.15817 without breaking below it, and for the 1h to stabilize again. Then I’ll consider going long on a pullback-and-recovery setup. Jumping in now means catching the first baton in this 28x-volume relay.
0.19247 is the dividing line—is this the first time the bulls have punched through the ceiling, or a short-term top created by a +21.68% deviation?
Here are the three charts. Are you betting it pulls back, holds 0.15817, then climbs again—or that it first takes a hit from this 92% closing position? Pick a side in the comments.
#ETH #BTC $ETH $BTC