🚨 The +250% trap: Will the dream of $AIN turn into a “liquidation” nightmare?
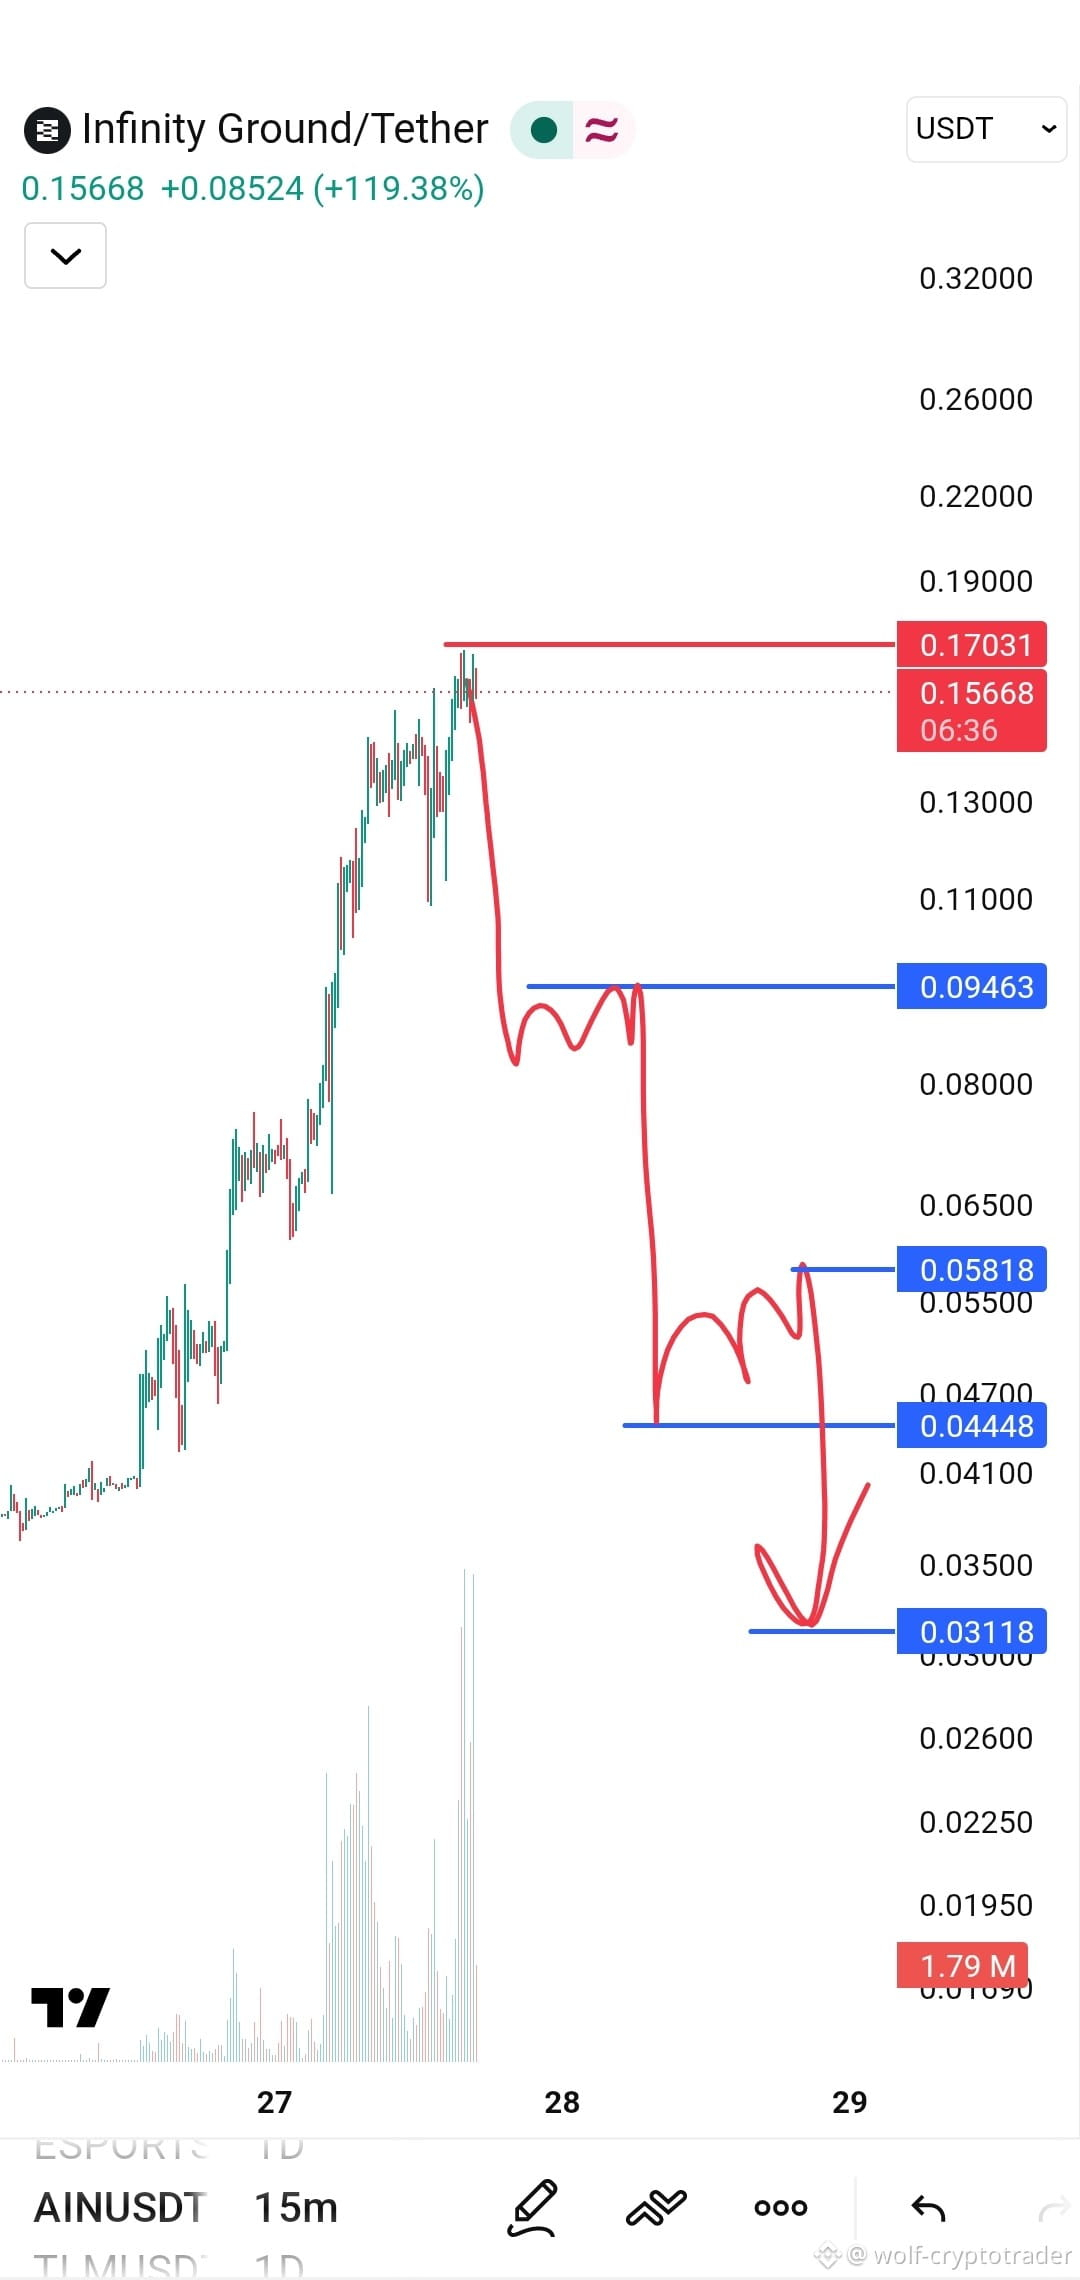
In the world of trading, towering green candles take your breath away, but experienced eyes see beyond that. Take a look at the Infinity Ground (AIN) chart on the 15m timeframe. A staggering +250% surge, followed by a brutal rejection from the top. What’s happening now isn’t the start of a rally, but the beginning of the bearish scenario drawn by the red arrow
In the world of trading, towering green candles take your breath away, but experienced eyes see beyond that. Take a look at the Infinity Ground (AIN) chart on the 15m timeframe. A staggering +250% surge, followed by a brutal rejection from the top. What’s happening now isn’t the start of a rally, but the beginning of the bearish scenario drawn by the red arrow