$XRP
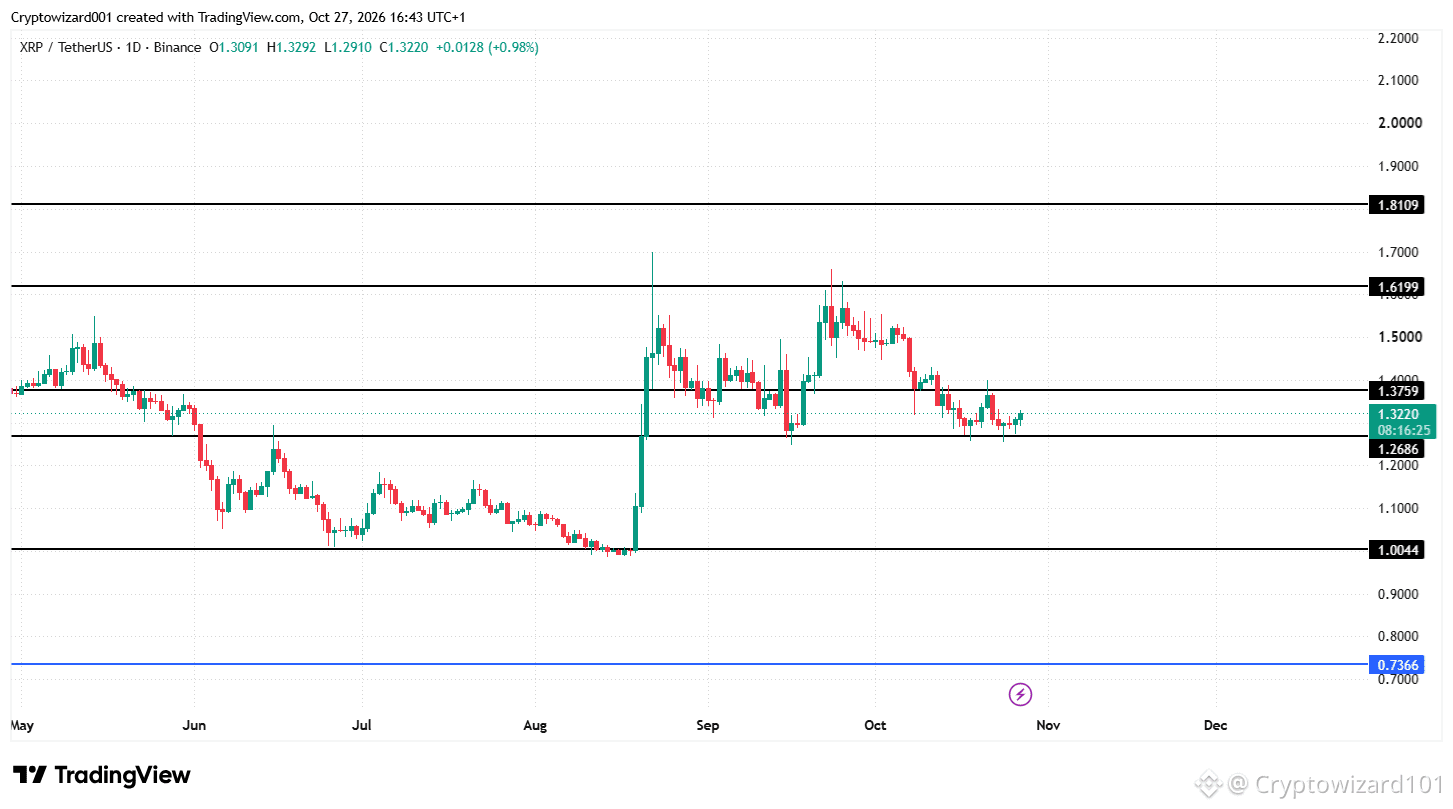
The XRP daily chart is clearly showing a double-bottom pattern, suggesting that the bulls may not be done yet and further upside could be ahead.
XRP is down more than 13% over the past 30 days but up more than 23% over the past three months.
The key level to watch is $1.20. If the price drops below this level, the trend could shift from bullish to bearish, potentially sending XRP toward $1.00.
For the uptrend to continue, XRP needs to hold above $1.30. It's also important to note that there was significant selling pressure between $1.20 and $1.40. Strong demand will be needed to break through this resistance zone. Once that happens, XRP could target $1.70.
#XRP #Crypto #Altcoins