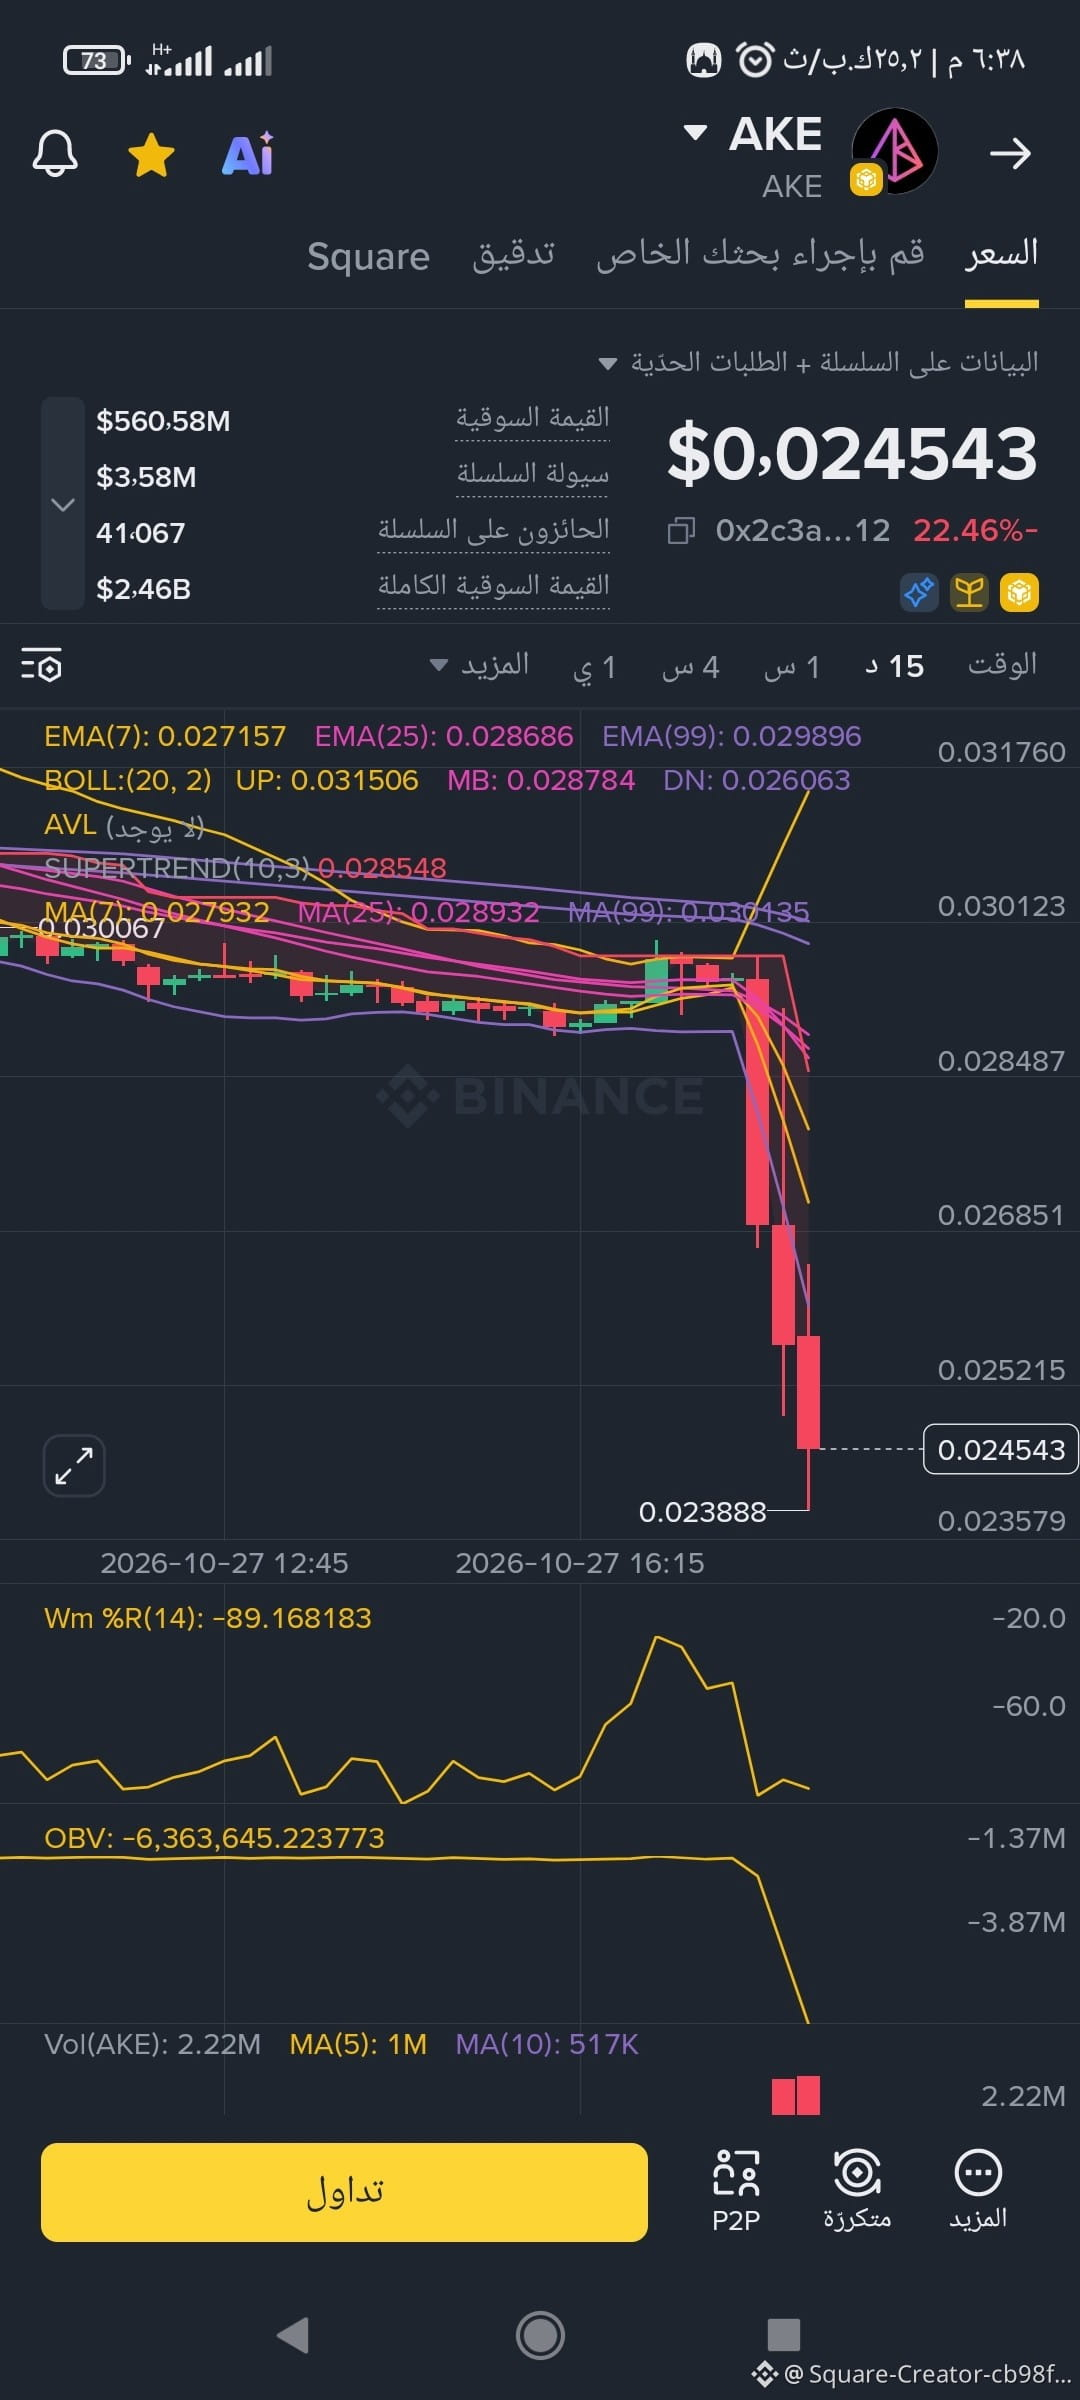
$AKE Technical analysis of AKE’s decline
The token has experienced a very sharp drop in a short period (around 20–22%, from 0.029–0.030 to approximately 0.0247). This is not an ordinary correction, but a strong sell-off (dump).
What does the chart say?
Selling pressure is very strong — consecutive long red candles with high volume indicate organized selling (likely by whales or a large-scale exit).
All momentum indicators have reached extreme oversold levels. This does not mean the price will rebound immediately, but it does mean that selling pressure has become excessive and a short-term technical rebound may occur.
Liquidity is relatively low compared with the market cap, making the price sensitive to any large sell order.
The technical structure has broken down sharply. All moving averages (EMA 7/25/99 and MA) are now above the price.
Possible scenarios:
Continued bearish scenario (currently the most likely):
If the price breaks below 0.0238 and holds there → targets the 0.022–0.020 range
Any weak rebound below 0.026–0.027 is likely to be sold off again
Technical rebound scenario:
With RSI and StochRSI at extreme levels, the price could see a quick rebound to the 0.0265–0.028 area (which was previously support and has now turned into resistance)
It needs genuine buying volume and must not close below 0.0238
Important notes:
This kind of decline in tokens of this size is often associated with whale selling, negative news, or position liquidations.
On-chain liquidity is not very high, so any additional selling pressure could cause a faster drop.
The token carries a high-volatility warning from the platform itself (Risk Warning).