Beginner Lesson 22: Why Does the Price Keep Failing to Rise Here? How to Read Support and Resistance
Simply put, support and resistance are areas on the chart where there are more buyers or more sellers. Beginners don’t need to master complex indicators, but before placing a trade, they should at least know where selling pressure might be strong above and where buyers might step in below.
I. First, understand what they are
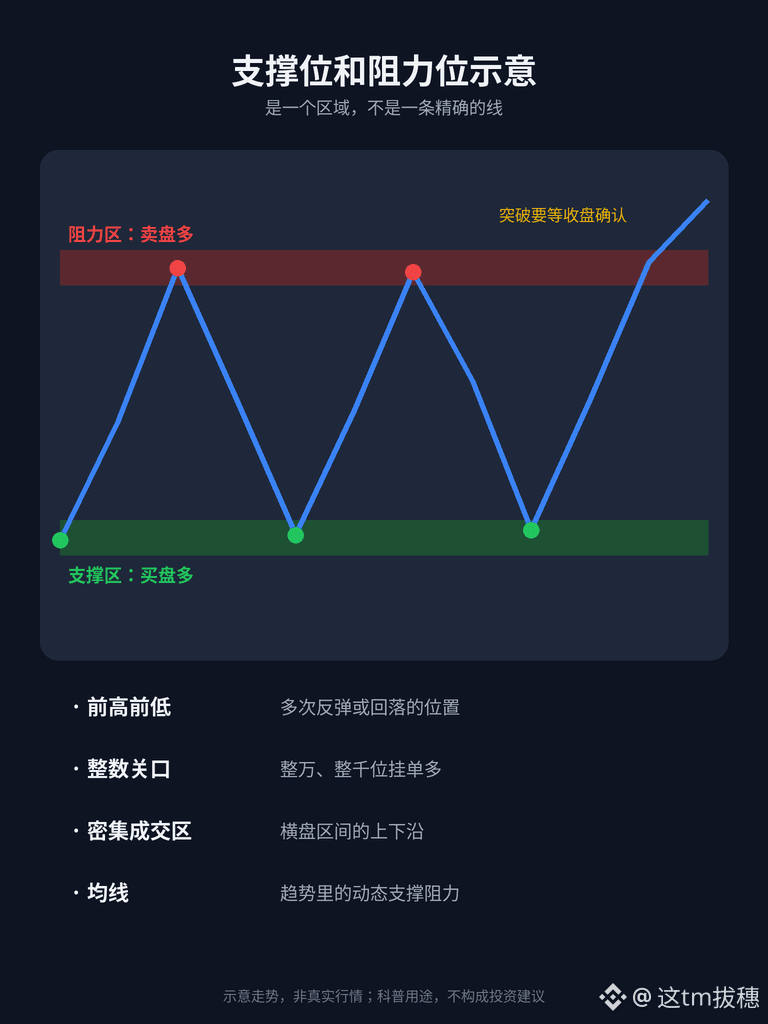
1) Support: When the price falls to this area, buyers may step in, and the decline may slow or reverse;
2) Resistance: When the price rises to this area, sellers may emerge, and the rise may stall or reverse;
3) They are zones, not exact lines. It’s perfectly normal for the price to briefly pierce a level by a few points—don’t panic because of it.
II. Four common ways beginners identify them
1) Previous highs and lows: Areas where the price has rebounded or pulled back multiple times before. This is the most common and intuitive method;
2) Round-number levels: For example, the ten-thousand mark of $BTC or the thousand mark of $ETH —many people place orders at these levels;
3) High-volume trading zones: Ranges where the price has moved sideways for a long time. The upper and lower boundaries often act as support and resistance;
4) Moving averages: For example, the 20- and 60-period moving averages, which are often treated as dynamic support or resistance in trending markets.
When several methods point to the same level, it is generally more useful as a reference.
III. How to use them when placing trades
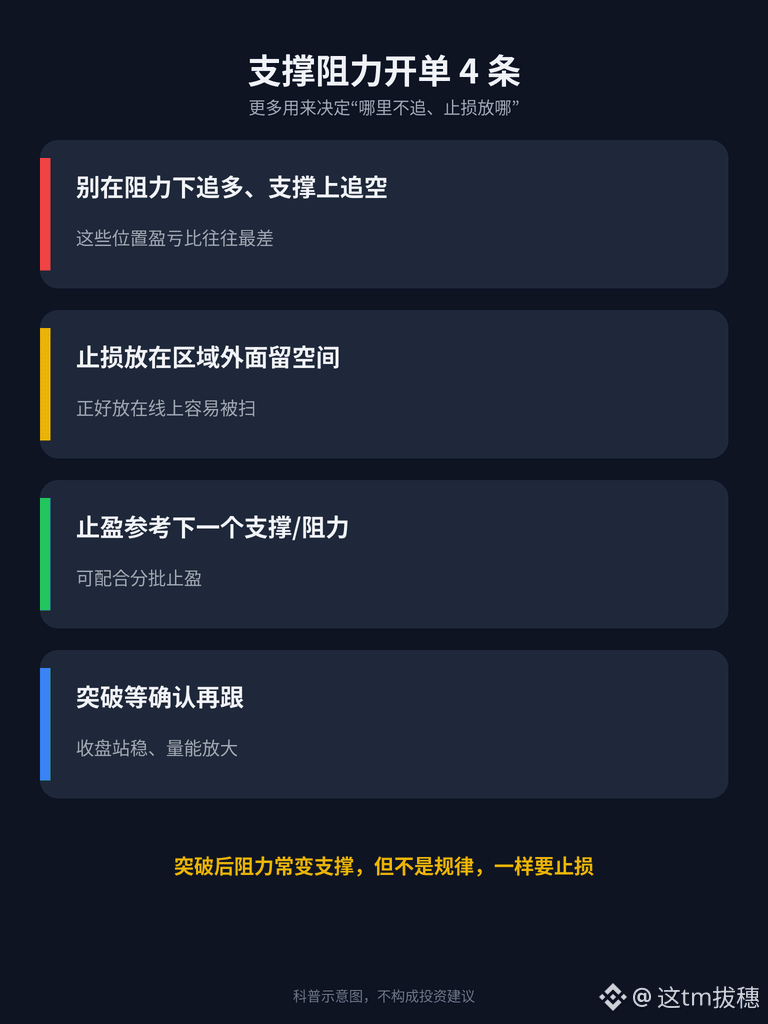
1) Don’t chase long positions just below resistance, or short positions just above support; the risk-to-reward ratio is often worst in those areas;
2) Leave some room when placing a stop-loss below support or above resistance. Don’t put it right on the level, where it can easily get swept;
3) You can use the next resistance (for a long position) or support (for a short position) as a take-profit reference. This also works well with the partial take-profit approach mentioned in the previous lesson;
4) Wait for confirmation of a breakout: for example, a candlestick closing firmly beyond the level and an increase in trading volume. Then consider following the move—don’t jump in just because the price briefly pokes above the level intraday.
IV. “Role reversal”
After resistance is decisively broken, it often becomes new support. After support is broken to the downside, it often becomes new resistance. This is the idea behind many “pull back, hold, then rise” moves. But it’s only a common occurrence, not a rule, so always use a stop-loss.
In short: Support and resistance are zones, not lines. They’re more useful for identifying “where not to chase” and “where to place stop-losses and take-profits” than for predicting whether prices will rise or fall. Practicing by drawing them on historical charts is more useful than reading ten articles.
Do you find drawing lines useful, or do you trust indicators more? Let’s discuss in the comments.
The content above is for educational purposes only and does not constitute investment advice. Crypto assets are highly volatile, and futures contracts carry even greater risks. Please only trade with money you can afford to lose.
#新手入门 #技术分析 #BinanceSquare