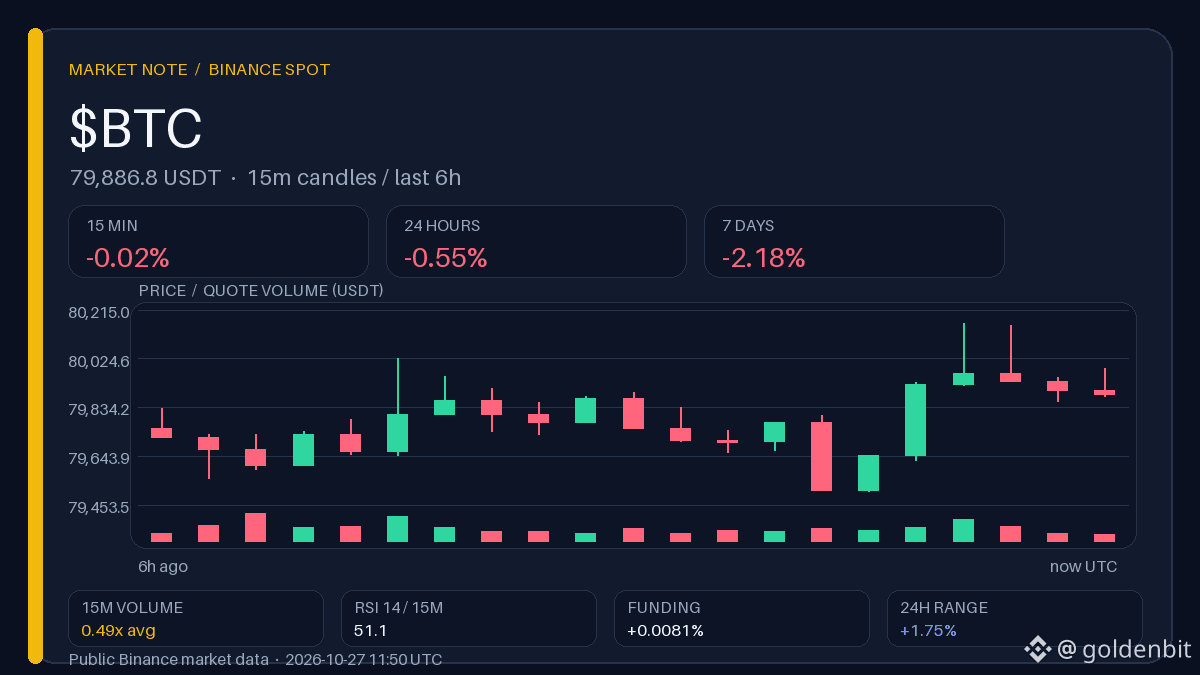
$BTC Below $80,000: The market didn’t buy the Asian rally
The key point here isn’t the decline, but the divergence: external optimism didn’t carry over to Bitcoin, changing how we should interpret its weakness. Over 15 minutes, the price barely moved on volume at ×0.49 of normal — the decline is happening without selling pressure, not because of it.
Range map · 15m, last 5h
Upper boundary: 80,162.44. Weekly high: 84,898.00. A close above the upper boundary of the local range, accompanied by rising volume, would cast doubt on the weak-demand hypothesis.
Lower boundary: 79,506.00. Weekly low: 79,220.74. A move back below the lower boundary of the range, with accelerating volume, would confirm that the weekly decline of −2.18% has further to run.
How to read this: The price is inside the range, far from its boundaries. A candle closing beyond a boundary signals a breakout; a single wick is only a brief move through it. Compare volume with its usual level to assess the strength of the move.
These are historical structure levels for educational purposes, not entry points, trade targets, or trading recommendations.
🗞 News: CoinDesk.
↩️ Recap of the previous “Volume Radar” issue (26.10 13:47 UTC): BTC 79,773.72 → 80,191.24 USDT (+0.52% in 12h), funding rate +0.009% → +0.010%.
What would need to change in volume for the current quiet weakness to stop looking like a pause?
Binance data, snapshot at 11:50 UTC. The author may receive rewards through Binance Square Write to Earn.