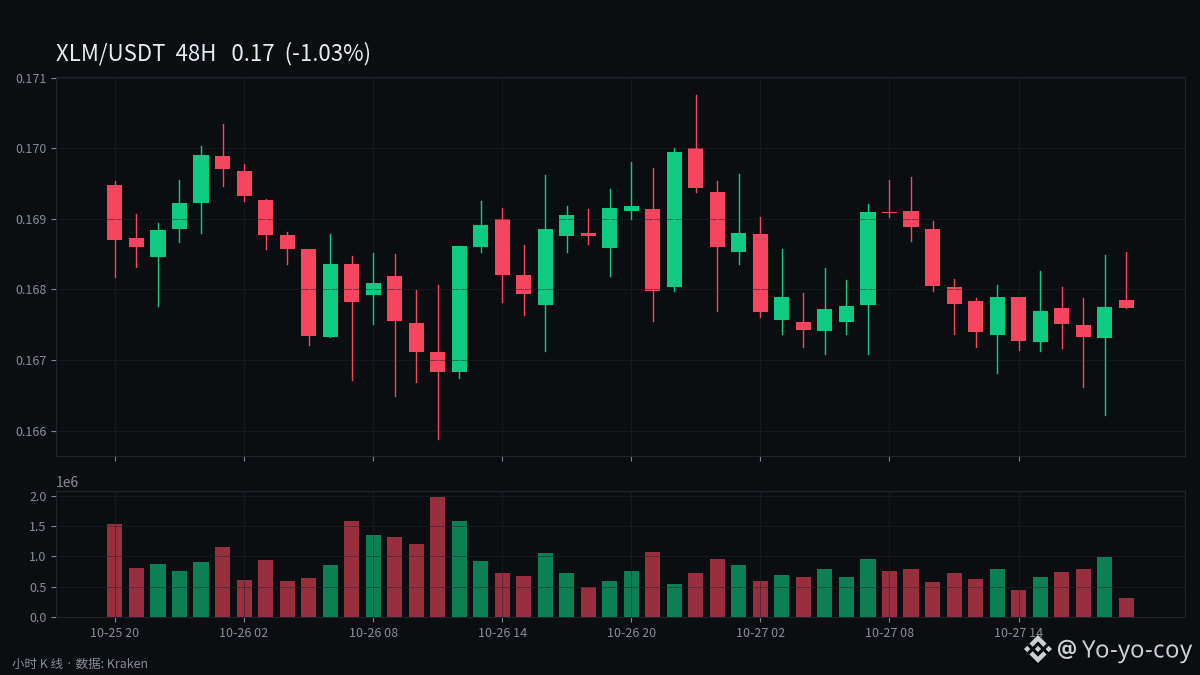
XLM’s price action is a textbook weak, range-bound pattern: it closed slightly higher, but hit a 60-day low intraday, and the highs continue to move lower.
1. Price: XLM closed at $0.1691 on October 26, up 0.76%, but its intraday low of $0.165886 marked a 60-day low. The day’s high of $0.170762 was below the previous day’s $0.172187, leaving the sequence of lower highs intact.
2. Volatility is narrowing: The 14-day ATR fell to $0.009072, about 5.37% of the closing price. In a weak market, narrowing volatility is more likely to signal fading momentum than a bottom.
3. The moving-average structure remains bearish: Technical analysis on October 27 noted that the RSI is near 40 and not yet oversold, leaving room to fall. A break below the recent low around $0.167 could put the next reference level near $0.15, about 11% lower. Conversely, XLM would need to reclaim $0.18 and rise above the 200-day moving average near $0.19 to invalidate the bearish structure.
4. Mid-term context: Finnhub data for October 27 showed XLM down about 3.25% over five days and 21.36% over 30 days, with a market cap of about $5.92 billion. The Protocol 30 testnet vote for the Bell protocol on November 3 is a near-term event worth watching.
The price has not yet fully played out its decline, and until the moving averages turn bullish, buying support around $0.15 is the only signal worth waiting for. These are my personal views and do not constitute investment advice.
#XLM #Stellar