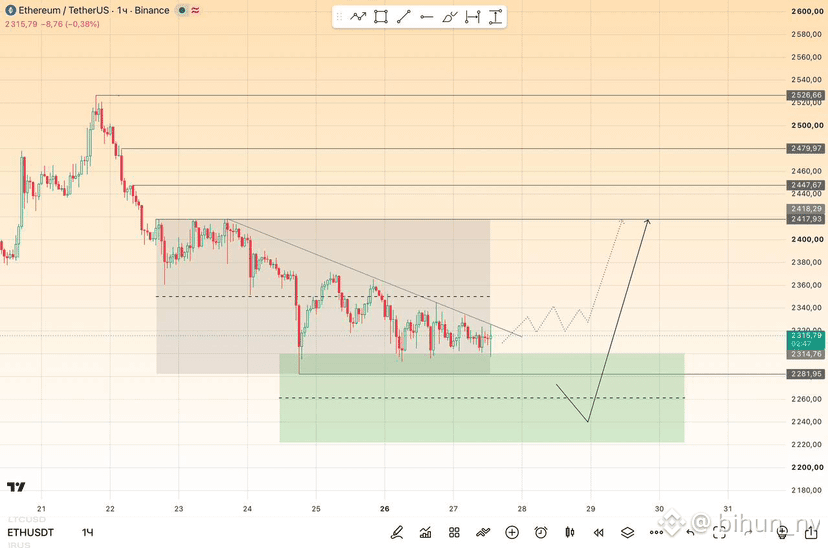
$ETH The chart clearly outlines two potential scenarios for a move near the current descending resistance trendline:
1. Breakout and consolidation (dashed line): The price breaks through the trendline, makes a local retest, and moves up toward the 2417 resistance zone.
2. Pullback to the support zone (solid line): The price fails to break through resistance and drops into the green support zone (levels 2240–2260), then reverses and climbs sharply toward the same target of 2417.