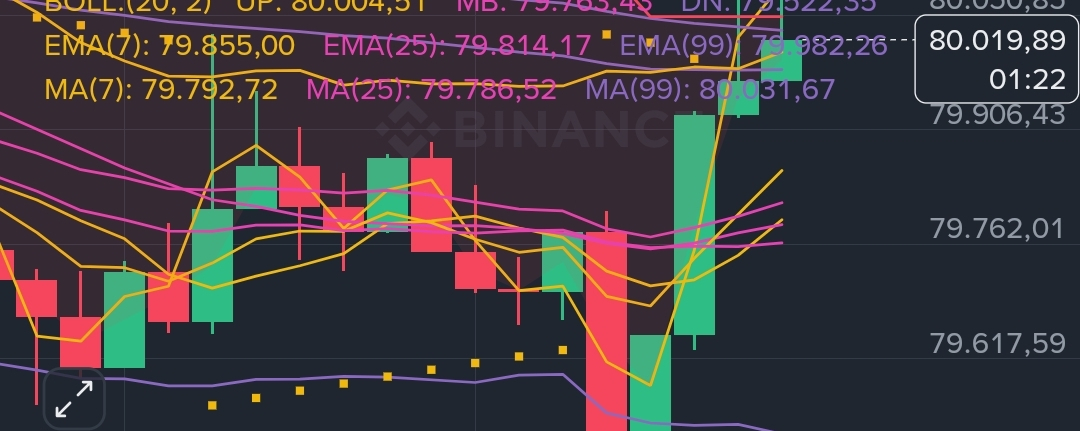

BTC/USDT technical analysis (short term) – based on the Binance chart
Current price: ~80.020 USDT (-0.32%)
Timeframe: intraday chart (probably 15 min or similar), session of 27/10/2026.
What the chart shows
The price formed a clear low at 79.506 and recovered strongly with consecutive green candles, reaching a test of 80.162. It is now consolidating slightly below that peak, still above most of the short-term moving averages.
Key indicators:
- Supertrend (10,3): 80.048 → price is practically touching it / slightly below (decision zone).
- Bollinger (20,2): Price near the upper band (80,004). The middle band is at 79,763.
- EMAs / MAs: EMA7 (79,855) and EMA25 (79,814) are below the price. EMA99 and MA99 are slightly higher (~79.98–80.03). The short moving averages are sloping upward.
- MACD: Positive DIF (1.64), green histogram and rising → bullish momentum is still present.
- RSI(6): 68.34 → elevated, but not yet in extreme overbought on the short timeframe.
- StochRSI: 100 / MA 77.48 → overbought.
- KDJ: J at 91.42 → also overbought.
- Williams %R: -21.72 → high zone.
- OBV: rising in the last candles → volume is accompanying the move up (good sign).
- Recent volume has been higher on bullish candles.
Bullish in the short term after bouncing from support at 79,500–79,520. The price managed to move out of the downside region and is testing immediate resistance around 80,050–80,160.
However, several oscillators (StochRSI, KDJ, and short-term RSI) are in overbought territory, which increases the likelihood of a pause / pullback before continuing.
#BitcoinSlipsBelow$80KAgain Important levels to watch
Resistances:
- 80,050 – 80,090 (Supertrend + recent high)
- 80,160 – 80,200
- 80,400–80,500 (next target if it breaks strongly)
Supports:
- 79,850 – 79,900 (short moving averages)
- 79,760 – 79,780 (Bollinger midline)
- 79,520 – 79,500 (day low + lower Bollinger band) → a break below this level would significantly weaken the short-term bullish scenario.
Possible scenarios
1. Continued upside (more likely if volume confirms):
Hold above 80,050 and break 80,160 with volume → next target 80,400–80,500.
2. Healthy pullback:
Correction to 79,850–79,760 (or even 79,600) and then resume. This would be the cleanest scenario.
3. Loss of strength:
Clear break below 79,500 with volume → opens room to 79,200–79,000.