BMT is down 14%—don’t assume the top loser means something suddenly went wrong with the project
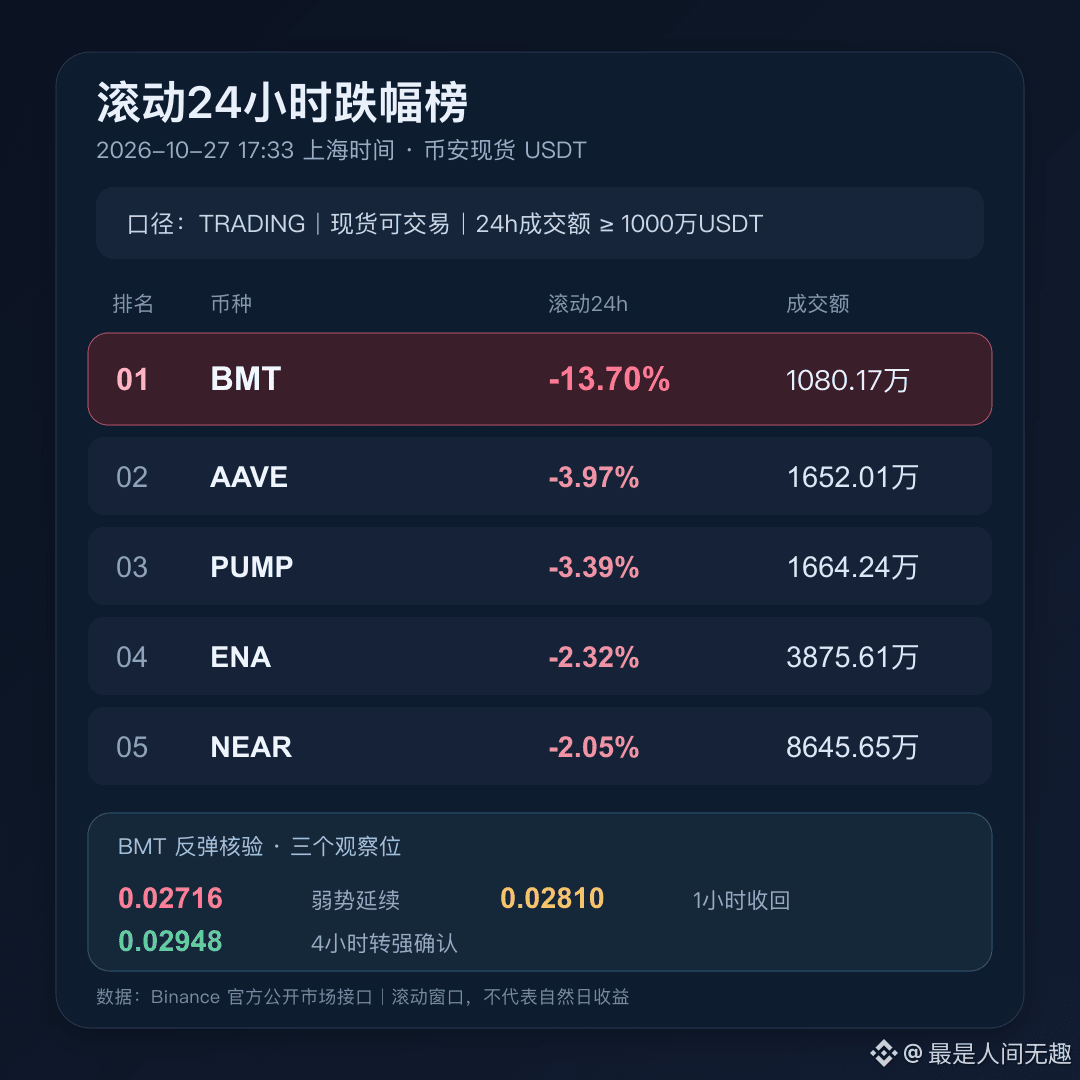
$BMT recorded a -13.70% rolling 24-hour decline on Binance spot at 17:33 (Shanghai time), with a trading volume of 10.8017 million USDT. It is indeed the biggest decliner among the qualifying assets, but let’s break down the conclusion first: the broader market is weak today, but that alone is not enough to explain the entire drop.
On the same basis, among 25 USDT spot assets meeting the 10 million USDT trading-volume threshold, 18 fell and 7 rose, with a median change of just -0.87%. BMT fell about 12.84 percentage points more than the median, indicating both broader market beta and notably greater selling pressure in this individual asset. The contrast is clear: AAVE was down 3.97%, PUMP 3.39%, ENA 2.32%, and NEAR 2.05%.
Why reassess now? The 0.02764 invalidation level I set for BMT on October 23 has been breached. The price in this snapshot is 0.02740, and the 24-hour low is 0.02716. The previous bullish watch framework should be closed at this point; we can’t automatically relabel it an “opportunity” just because the price is lower.
Verified facts and unconfirmed explanations
Upbit Data Lab labels BMT as a “new market trading support asset” and shows that it reached a high of 98.10 Korean won on October 24. The current price on the page is about 36.50 won, roughly 62.79% below the high. This confirms recent support from a new market and a sharp repricing, but timing alone is not enough to claim that a specific news item triggered today’s decline. As of publication, no new negative catalyst sufficient on its own to explain this drop had been found in primary public information from the project or trading platforms. So “fading enthusiasm for the new market and a repricing of positions” is a testable hypothesis, not a proven cause-and-effect explanation.
Volume also doesn’t support a simplistic label. The latest completed 1-hour candle closed at 0.02736, down from 0.02771, with 448,400 USDT in trading volume—1.08 times the median of the previous 24 completed 1-hour candles. This suggests the breakdown was confirmed by active trading. However, the latest completed 4-hour candle had a trading volume of 1.4986 million USDT, just 0.66 times the median of the previous 12 completed 4-hour candles. For now, there is no sign of sustained, surging panic volume.
Three scenarios to watch next
First, if 0.02716 is broken on a 1-hour close with elevated volume, and trading volume remains above the recent median, continued weakness will be confirmed and any rebound thesis should be put on hold.
Second, only if the price first reclaims 0.02810 on a completed 1-hour candle, then closes above 0.02944–0.02948 on a 4-hour candle, accompanied by a pickup in volume, will it indicate that buying is starting to absorb the selling pressure. A brief spike above the level without holding it would look more like a technical bounce.
Third, if the price stays between 0.02716 and 0.02810 while volume contracts, that is the base case: the market is still digesting positions accumulated after the new market support, rather than having already reversed direction.
If BMT rises above 0.02948 on strong volume and holds there, my view that “fading enthusiasm remains the main short-term driver” is invalidated. If it falls below 0.02716 and quickly reclaims it, beware of a false breakdown. The main risks are the short history of assets listed on new trading markets, rapid cross-market price discovery, and the fact that “no public catalyst found” does not mean no catalyst exists.
Click $BMT to check whether the current price has crossed 0.02716, 0.02810, or 0.02948, and whether volume confirms the move. Then decide whether this is a continuation of the decline, consolidation in a range, or a conditional rebound.
$BMT recorded a -13.70% rolling 24-hour decline on Binance spot at 17:33 (Shanghai time), with a trading volume of 10.8017 million USDT. It is indeed the biggest decliner among the qualifying assets, but let’s break down the conclusion first: the broader market is weak today, but that alone is not enough to explain the entire drop.
On the same basis, among 25 USDT spot assets meeting the 10 million USDT trading-volume threshold, 18 fell and 7 rose, with a median change of just -0.87%. BMT fell about 12.84 percentage points more than the median, indicating both broader market beta and notably greater selling pressure in this individual asset. The contrast is clear: AAVE was down 3.97%, PUMP 3.39%, ENA 2.32%, and NEAR 2.05%.
Why reassess now? The 0.02764 invalidation level I set for BMT on October 23 has been breached. The price in this snapshot is 0.02740, and the 24-hour low is 0.02716. The previous bullish watch framework should be closed at this point; we can’t automatically relabel it an “opportunity” just because the price is lower.
Verified facts and unconfirmed explanations
Upbit Data Lab labels BMT as a “new market trading support asset” and shows that it reached a high of 98.10 Korean won on October 24. The current price on the page is about 36.50 won, roughly 62.79% below the high. This confirms recent support from a new market and a sharp repricing, but timing alone is not enough to claim that a specific news item triggered today’s decline. As of publication, no new negative catalyst sufficient on its own to explain this drop had been found in primary public information from the project or trading platforms. So “fading enthusiasm for the new market and a repricing of positions” is a testable hypothesis, not a proven cause-and-effect explanation.
Volume also doesn’t support a simplistic label. The latest completed 1-hour candle closed at 0.02736, down from 0.02771, with 448,400 USDT in trading volume—1.08 times the median of the previous 24 completed 1-hour candles. This suggests the breakdown was confirmed by active trading. However, the latest completed 4-hour candle had a trading volume of 1.4986 million USDT, just 0.66 times the median of the previous 12 completed 4-hour candles. For now, there is no sign of sustained, surging panic volume.
Three scenarios to watch next
First, if 0.02716 is broken on a 1-hour close with elevated volume, and trading volume remains above the recent median, continued weakness will be confirmed and any rebound thesis should be put on hold.
Second, only if the price first reclaims 0.02810 on a completed 1-hour candle, then closes above 0.02944–0.02948 on a 4-hour candle, accompanied by a pickup in volume, will it indicate that buying is starting to absorb the selling pressure. A brief spike above the level without holding it would look more like a technical bounce.
Third, if the price stays between 0.02716 and 0.02810 while volume contracts, that is the base case: the market is still digesting positions accumulated after the new market support, rather than having already reversed direction.
If BMT rises above 0.02948 on strong volume and holds there, my view that “fading enthusiasm remains the main short-term driver” is invalidated. If it falls below 0.02716 and quickly reclaims it, beware of a false breakdown. The main risks are the short history of assets listed on new trading markets, rapid cross-market price discovery, and the fact that “no public catalyst found” does not mean no catalyst exists.
Click $BMT to check whether the current price has crossed 0.02716, 0.02810, or 0.02948, and whether volume confirms the move. Then decide whether this is a continuation of the decline, consolidation in a range, or a conditional rebound.