



Situation Analysis
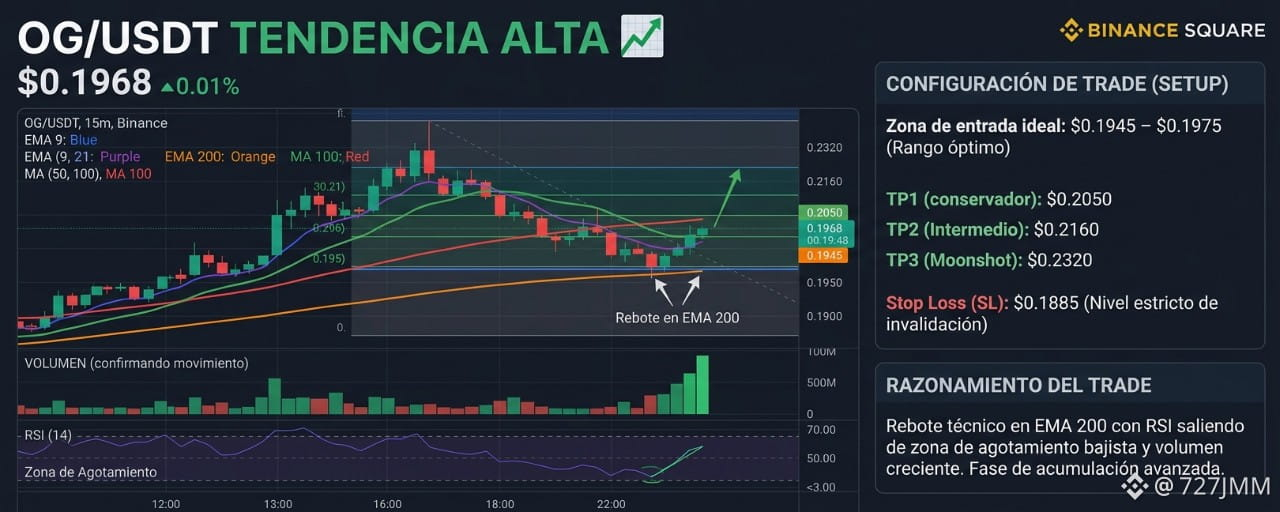
On the 15-minute, 5-minute, and daily timeframes, the price is trading at $0.1968, establishing a solid technical floor after a controlled correction. The 9 and 21 EMAs are showing an imminent bullish crossover in the short term, while the daily 200 EMA acts as the main macro support underpinning the entire bullish structure. The 50 and 100 MAs are converging in alignment to support the continuation of the trend.
Meanwhile, the RSI (14) stands at 52, having cleanly exited the bearish exhaustion zone and gaining buying momentum, with no signs of being overbought. This move is supported by a gradual increase in trading volume, confirming institutional inflows and the technical validity of the structure.
Trade Setup
Ideal Entry Zone: $0.1945 – $0.1975 (Current optimal accumulation range).
TP1 (Conservative): $0.2050 (Immediate psychological resistance and first profit-taking zone).
TP2 (Intermediate): $0.2160 (Technical target based on the next resistance level and Fibonacci retracement).
TP3 (Moonshot): $0.2320 (Maximum projected extension if buying strength persists).
Stop Loss (SL): $0.1885 (Mandatory: Strict technical invalidation level below key structural support).
Trade Range and Rationale
We are executing this position by taking advantage of a technical bounce off the 200 EMA, with the RSI emerging from the exhaustion zone and volume supporting the momentum. Structurally, we are in a clear accumulation phase, preparing for a bullish expansion.