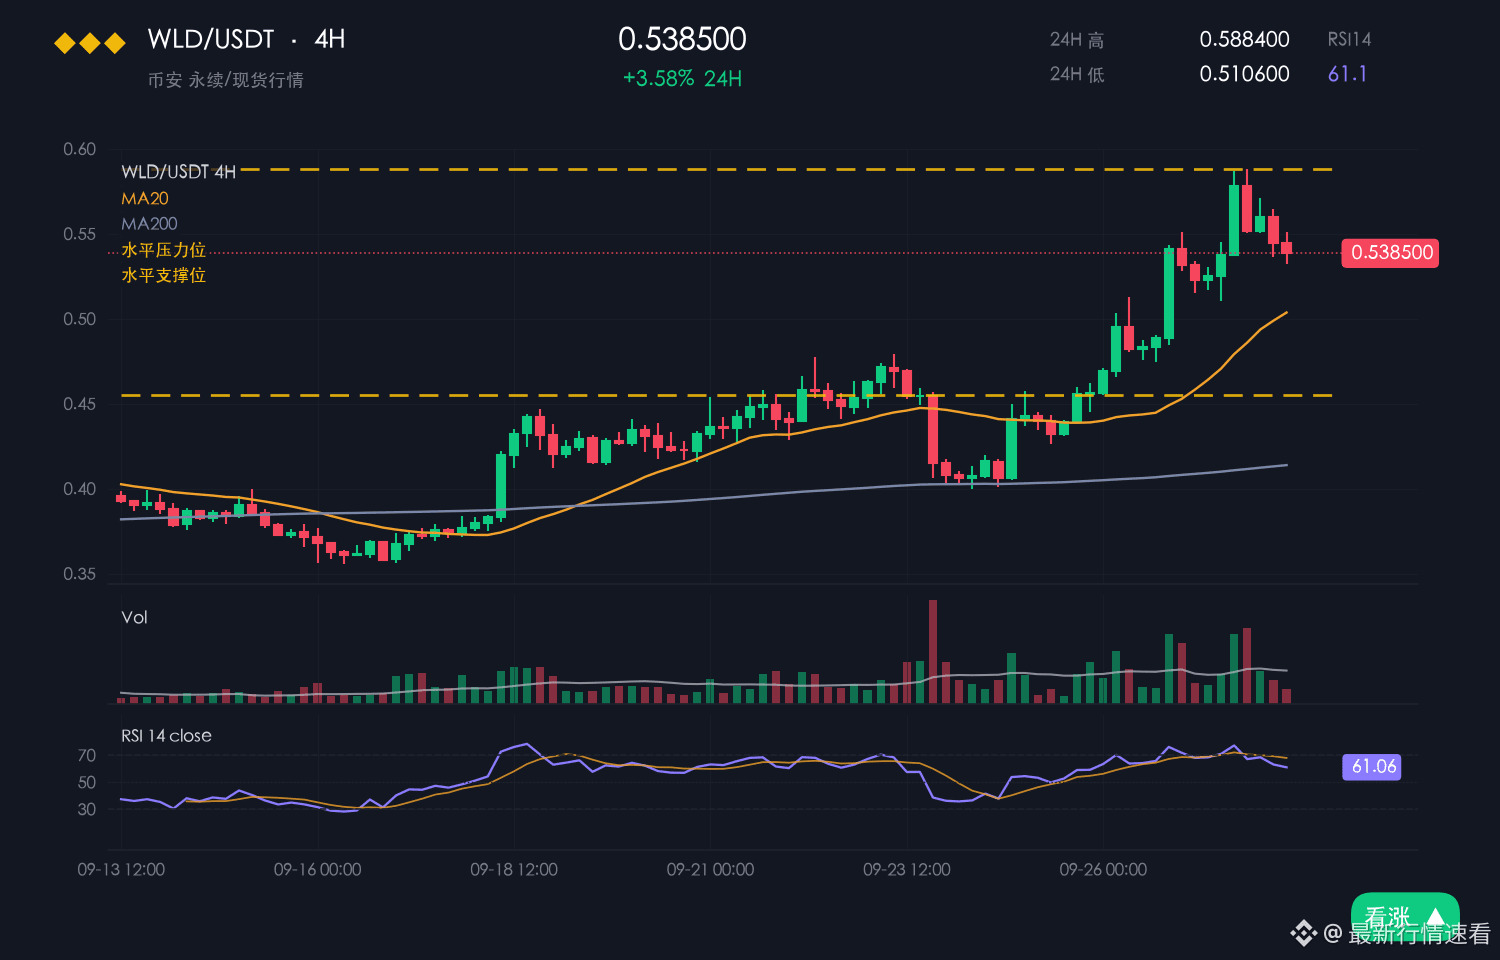
WLD is currently at 0.4393, down 5.71% over 24 hours and still down 13.51% over 7 days. Its intraday range is 0.4299–0.4668, with an amplitude of 8.6%.
【Market】
The overall picture is weak, and 0.4668 remains a key dividing line for WLD.
WLD pulled back after reaching a high of 0.4668. The 5.71% daily drop has steepened the 13.51% seven-day decline.
WLD moved lower within its 0.4299–0.4668 intraday range, and the rebound was notably lacking in volume.
The price is hovering near 0.4299; a break below this level would accelerate the decline.
Compared with BTC’s -0.62%, WLD is at the bottom in terms of relative strength, making it one of the assets the market has abandoned.
【Macro】 Overnight, U.S. stocks fell: Nasdaq -1.88%, S&P 500 -1.11% (closing figures for 2026-10-14). BTC ETFs have seen net outflows of around $45.2 billion this month, U.S. CPI came in above expectations at 3.7% year over year, and the probability of an interest rate hike at the 2026-10-27/28 meeting is around 47%. Spot BTC ETFs have seen net outflows of around $45.2 billion this month, as institutional buying has ebbed.
The short-term outlook leans bearish.
【Bearish Factors】
There’s more downside to watch if 0.4299 breaks; once lost, 0.4299 becomes a magnet.
The seven-day weakness of 13.51% is plain to see, and intraday back-and-forth isn’t enough to change the direction.
Let’s wait for the next candle to speak.
$WLD #WLD