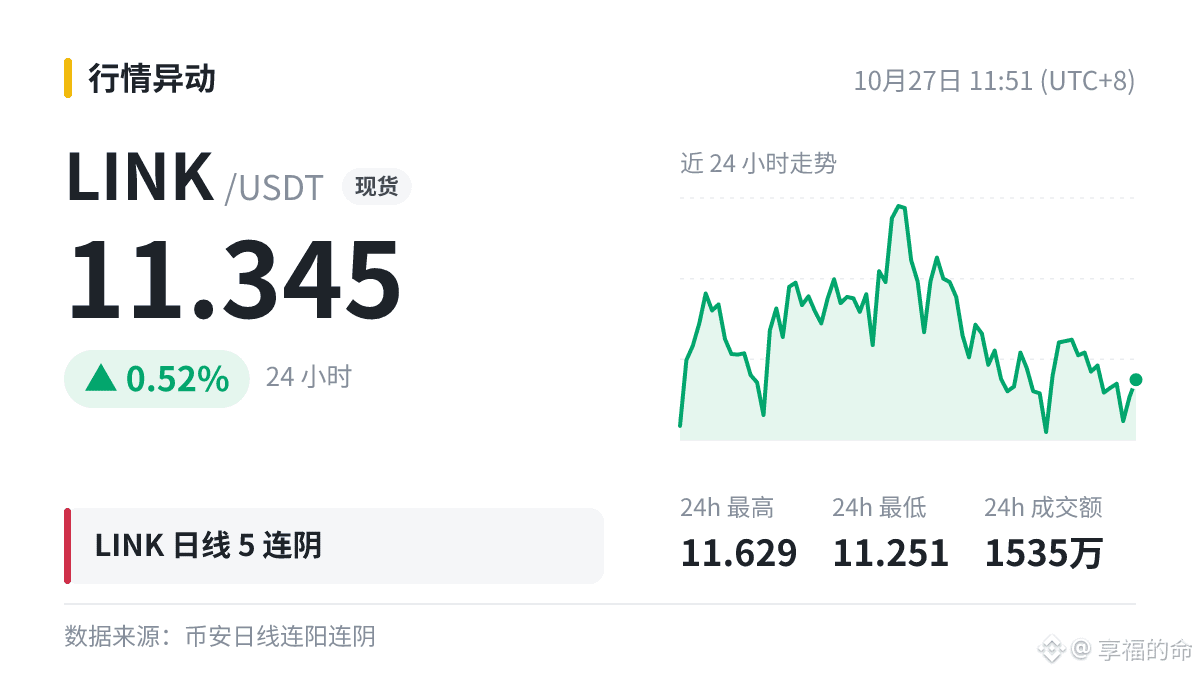
$LINK Daily chart: 5 consecutive down days, with a cumulative decline of 8.78%; down 0.48% so far today.
A beginner’s burning question: What do consecutive up and down days mean?
The cumulative percentage change is measured from the opening price of the first candle in the streak to the closing price of the latest one—it says more about the move’s strength than the number of days.
Five consecutive down days—that’s longer than I’ve stuck with working out.
All data only describes market movements that have already happened; the market could just as easily move in the opposite direction.
#LINK