First, a quick recap: Last time, I said I’d ease up if SOL reclaimed 104, and that my bearish target was 98.6. But over the past two days, it’s just been hovering around 100. It dipped to 99.88, briefly breaking below 100 before bouncing back. It didn’t reach 98.6 or 104—so the call hasn’t been invalidated, but it hasn’t played out either. The 100 level is still being tested.
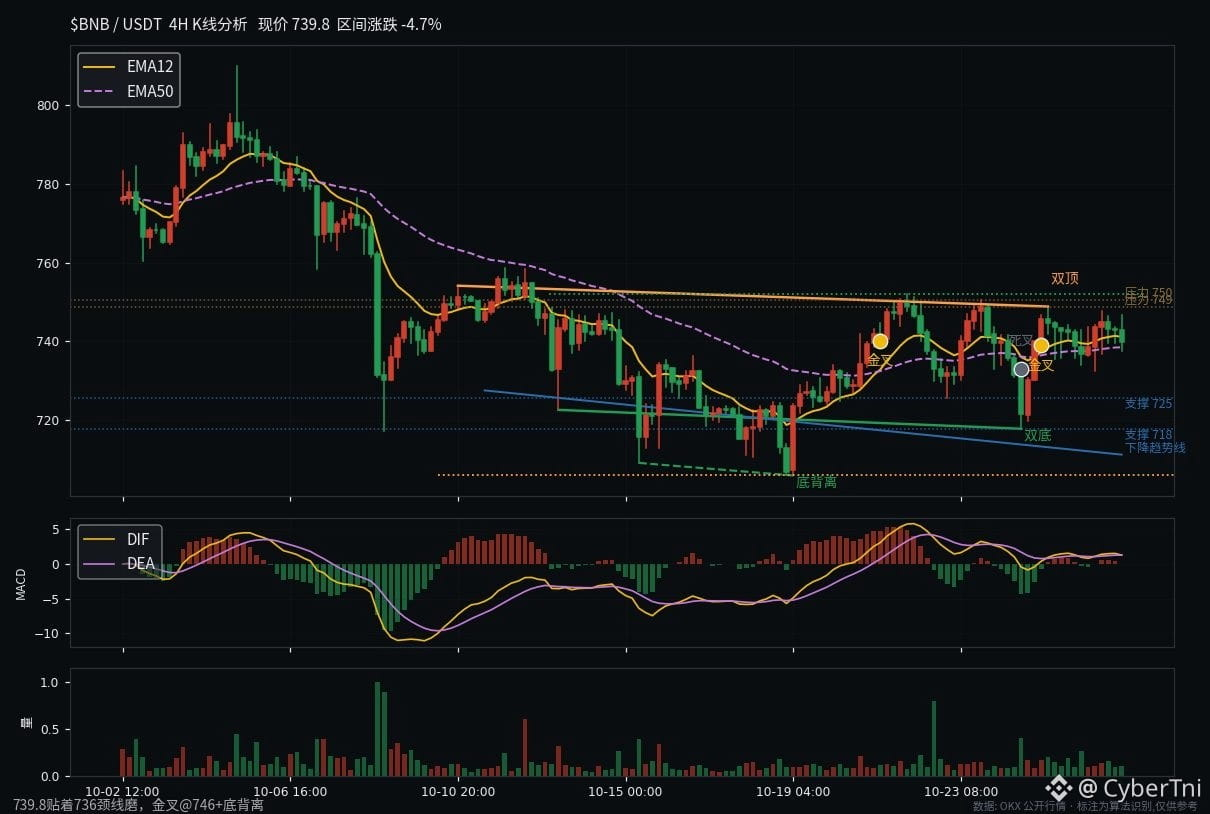
Now, $BNB : The chart shows a current price of 739.8, with a range of 717.7–750.5 over the last 24 bars. Overall, it’s been grinding sideways in a range. But there’s something interesting under the surface: after finding support around 717.7 with a double bottom, it formed a bullish MACD divergence—the price made a new low, but the indicator didn’t follow, suggesting the bears were losing steam. Then the EMA 12 and EMA 50 produced consecutive golden crosses at 741 and 746. Price moved back above the moving averages, and the uptrend line remains intact. The double-top neckline at 750 has capped price twice, while support is holding at 725 and 718.
Put simply, the bulls have just started to lift their heads, but BNB hasn’t cleared the hurdle yet. If it can’t break through 750, any rebound is just more range-bound churn. A sustained move above 750 could open the way to 760 and 780; a drop back below 718 would invalidate the bullish case. Just my opinion, not financial advice. Before the cards are revealed early Thursday morning, will BNB break above 750 first, or get dumped back to 718? Pick a side in the comments!
#USQ3GDPAndSeptemberPCEDueNextWeek #BNB #FOMC