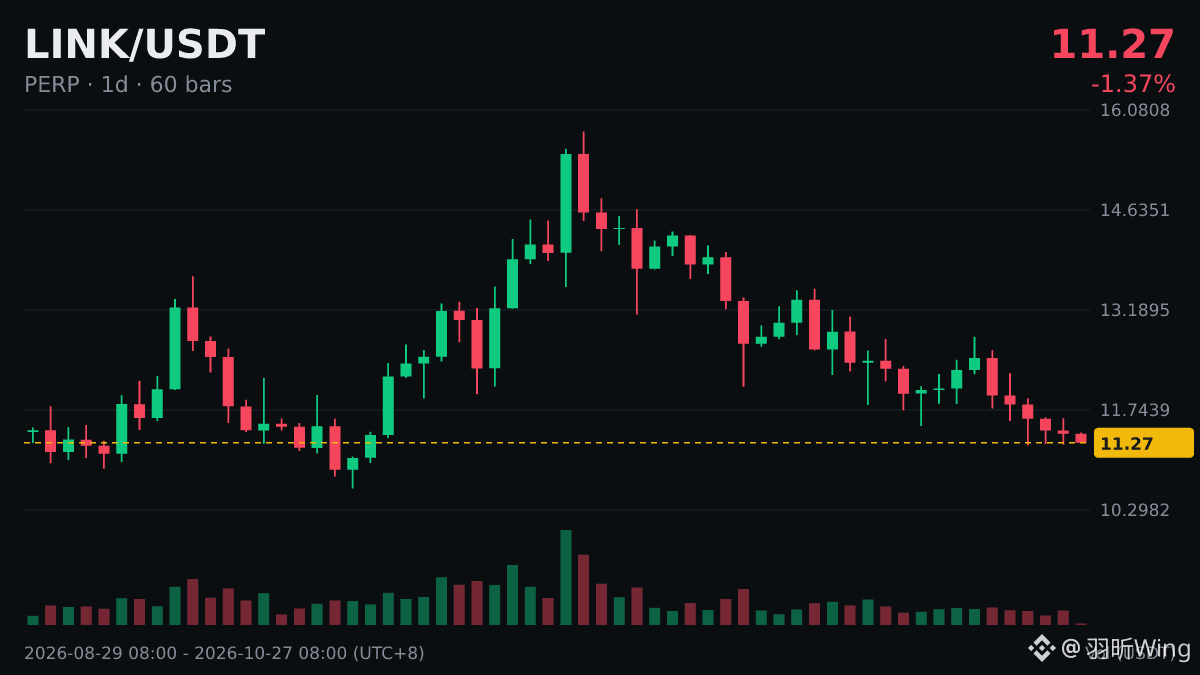
$LINK The daily chart has now posted five consecutive down days. There are generally three things to look at:
1) How big is the decline? -8.78%—not particularly large; it looks more like a slow slide, and there are no signs of a bottom yet.
2) Has the losing streak been broken today? It’s currently down 1.06%, so not yet.
3) What’s the volume like on the day it breaks? A bullish candle on high volume is more convincing than one on low volume.
What signal are you waiting for before making a move?
#LINK
1) How big is the decline? -8.78%—not particularly large; it looks more like a slow slide, and there are no signs of a bottom yet.
2) Has the losing streak been broken today? It’s currently down 1.06%, so not yet.
3) What’s the volume like on the day it breaks? A bullish candle on high volume is more convincing than one on low volume.
What signal are you waiting for before making a move?
#LINK