#bitmine增持10452枚eth 10.27 BTC Short-Term Long Setup: One Signal Has Changed
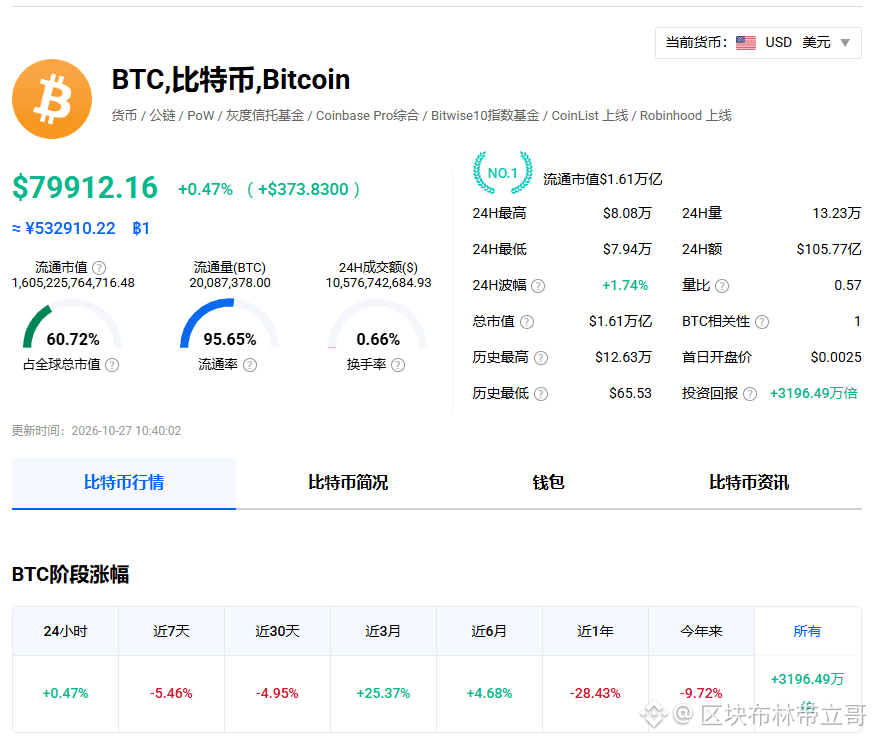
BTC is currently around 79,800, down 0.65% over the past 24 hours. It still looks weak on the surface, but something is quietly changing beneath the surface.
First, here are three reasons to consider going long.
First, options skew is narrowing. Glassnode data shows that the 25 Delta Skew has narrowed significantly across maturities, with short-term skew turning negative. In other words, traders were previously paying for downside protection, but that demand is fading. Positioning is starting to shift toward neutral or even bullish. This is the exact opposite of the “buying puts” options setup we saw a few days ago.
Second, buyers are stepping in around the 79,300–79,000 range. Data shows roughly $73 million in buy orders clustered above $79,300, while sell orders are concentrated around $81,000. In other words, there’s less resistance on the way down than on the way up, leaving room for a short-term long trade.
Third, the funding rate structure is changing. KuCoin data shows BTC’s funding rate at -0.0005%, meaning shorts are paying longs. If the price moves back above $80,000, those shorts may be forced to buy back their positions, creating short-term squeeze pressure.
But there’s one caveat to be clear about.
A substantial portion of the $80 million in buy orders between $78,000 and $79,000 consists of futures orders, not spot bids. Futures orders can be canceled before they’re filled, so this isn’t a rock-solid floor. You can go long, but don’t set your stop-loss based on the assumption that “someone will catch it.”
Key levels
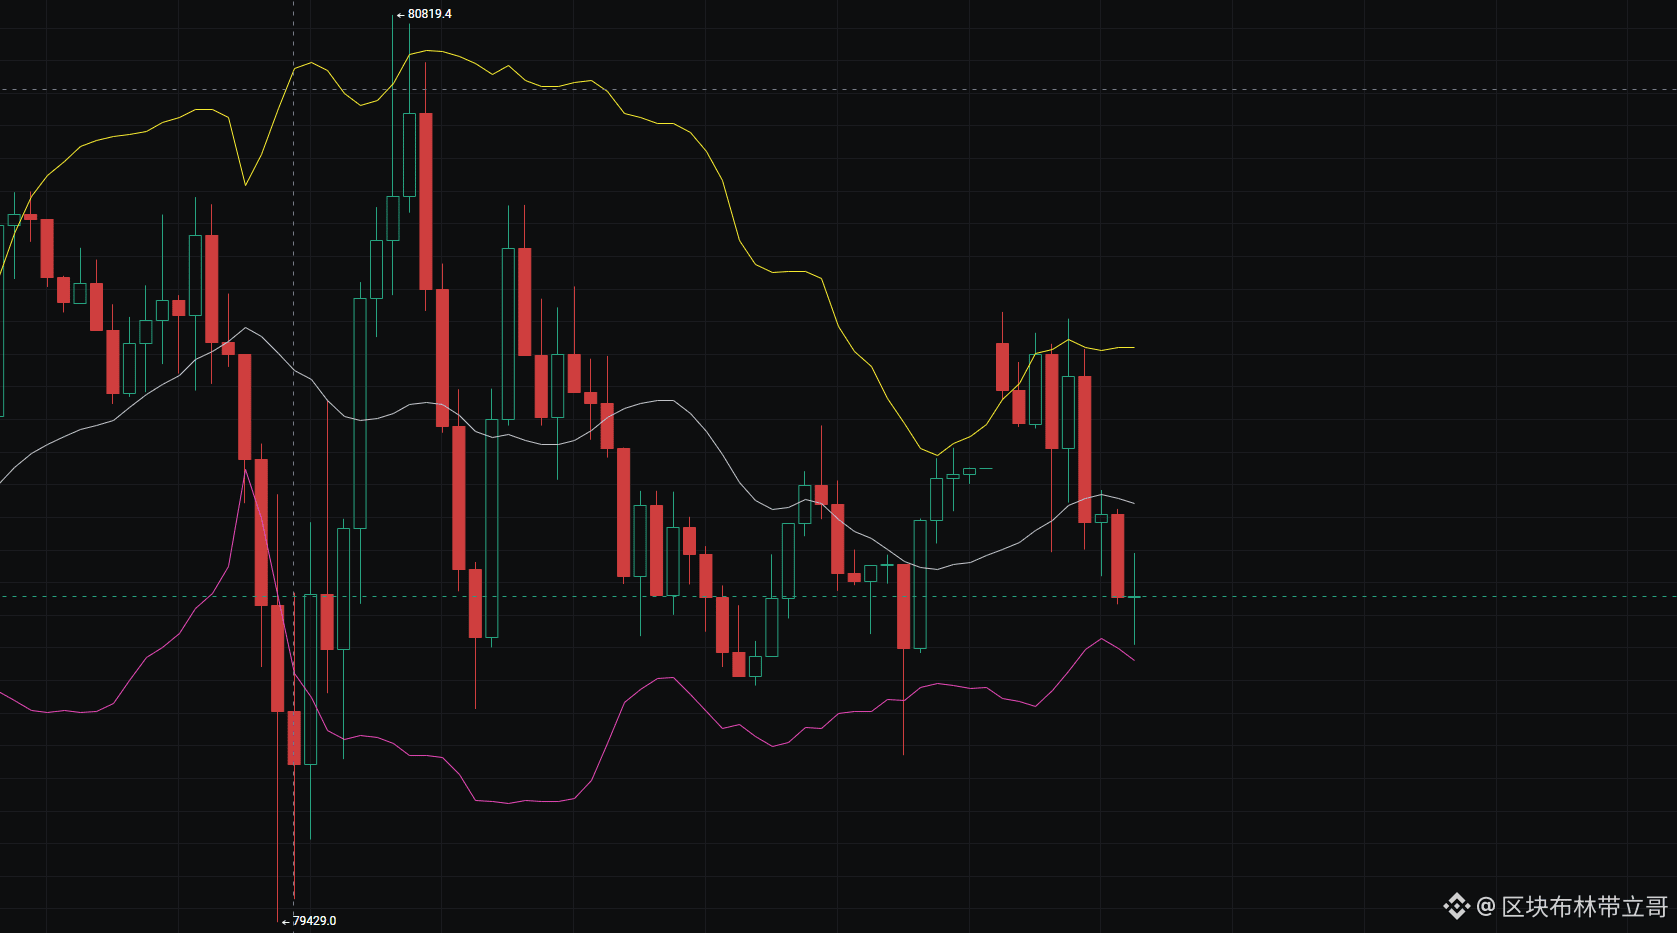
To the upside, watch $80,500–$81,000 first. This is a dense sell zone and the first short-term resistance. If BTC breaks through, the next level to watch is $81,500.
To the downside, $79,000 is where buy orders start to cluster, while $78,800 is a more reliable support reference.
Trading plan
Consider a small long position around the current price of $79,800, with a stop-loss below $78,800. Don’t put it at $79,000—it’s too close and could easily get swept by a wick.
First target: $80,500–$80,800. Take half off there.
Second target: $81,000–$81,200. Exit the rest there.
If the price drops straight through $78,800 and fails to reclaim it, close the long and don’t hold on. A break below that level would suggest the futures orders have been pulled and the buying interest was fake.
In short: options skew has turned negative, shorts are paying, and there are buy orders above $79,300. Taken together, these three signals give a short-term long trade a reasonable basis. But remember, those buy orders may be futures orders, so place your stop farther away and keep your position size small.
BTC is currently around 79,800, down 0.65% over the past 24 hours. It still looks weak on the surface, but something is quietly changing beneath the surface.
First, here are three reasons to consider going long.
First, options skew is narrowing. Glassnode data shows that the 25 Delta Skew has narrowed significantly across maturities, with short-term skew turning negative. In other words, traders were previously paying for downside protection, but that demand is fading. Positioning is starting to shift toward neutral or even bullish. This is the exact opposite of the “buying puts” options setup we saw a few days ago.
Second, buyers are stepping in around the 79,300–79,000 range. Data shows roughly $73 million in buy orders clustered above $79,300, while sell orders are concentrated around $81,000. In other words, there’s less resistance on the way down than on the way up, leaving room for a short-term long trade.
Third, the funding rate structure is changing. KuCoin data shows BTC’s funding rate at -0.0005%, meaning shorts are paying longs. If the price moves back above $80,000, those shorts may be forced to buy back their positions, creating short-term squeeze pressure.
But there’s one caveat to be clear about.
A substantial portion of the $80 million in buy orders between $78,000 and $79,000 consists of futures orders, not spot bids. Futures orders can be canceled before they’re filled, so this isn’t a rock-solid floor. You can go long, but don’t set your stop-loss based on the assumption that “someone will catch it.”
Key levels
To the upside, watch $80,500–$81,000 first. This is a dense sell zone and the first short-term resistance. If BTC breaks through, the next level to watch is $81,500.
To the downside, $79,000 is where buy orders start to cluster, while $78,800 is a more reliable support reference.
Trading plan
Consider a small long position around the current price of $79,800, with a stop-loss below $78,800. Don’t put it at $79,000—it’s too close and could easily get swept by a wick.
First target: $80,500–$80,800. Take half off there.
Second target: $81,000–$81,200. Exit the rest there.
If the price drops straight through $78,800 and fails to reclaim it, close the long and don’t hold on. A break below that level would suggest the futures orders have been pulled and the buying interest was fake.
In short: options skew has turned negative, shorts are paying, and there are buy orders above $79,300. Taken together, these three signals give a short-term long trade a reasonable basis. But remember, those buy orders may be futures orders, so place your stop farther away and keep your position size small.