🚨 $Q USDT (Quack AI): INSANE +260% PUMP! BUY THE TOP OR CATCH THE BOTTOM NOW? 📊
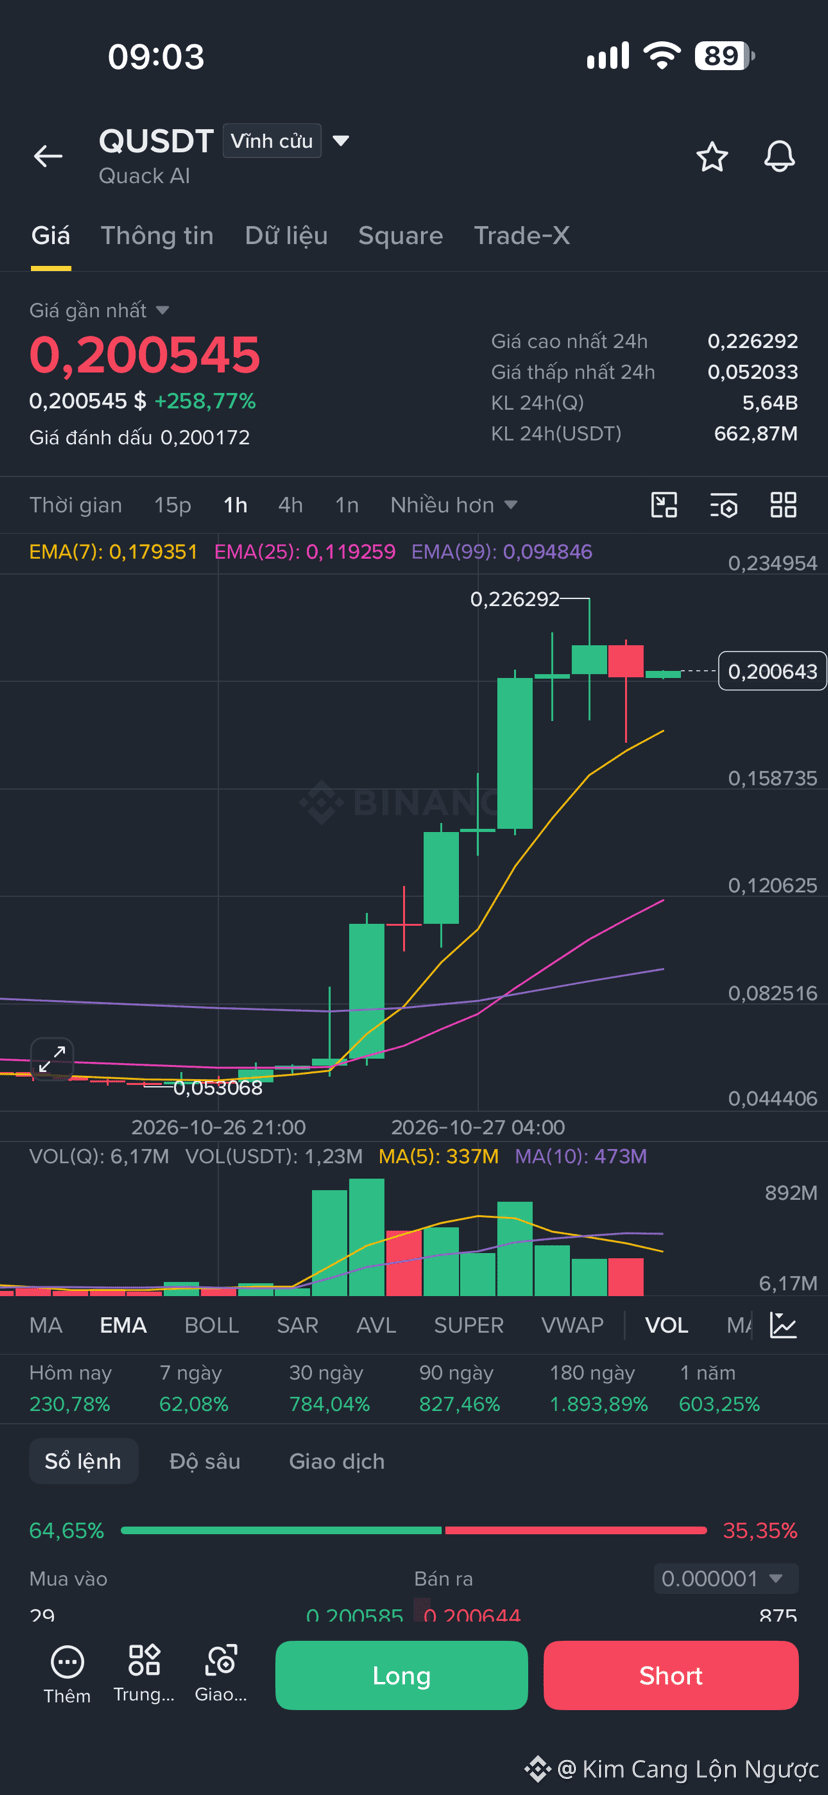
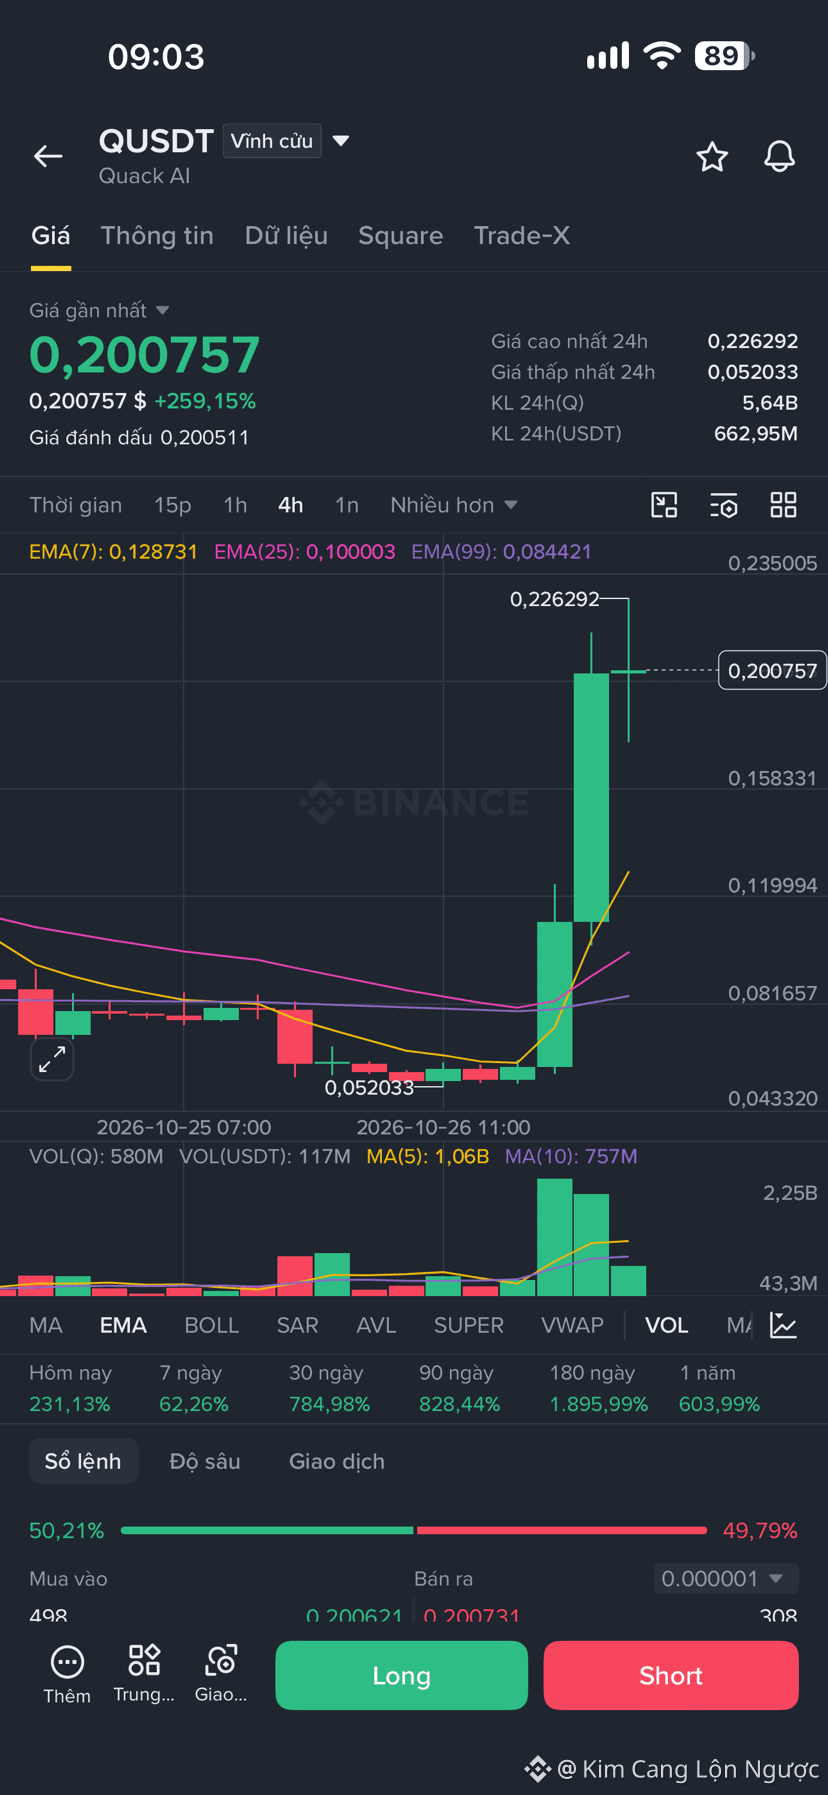
Looking at Quack AI's chart, everyone has to "pick their jaw up off the floor" at the breakneck pace of its rise: from 0.05 to over 0.22 in just a few hours, a gain of +259% in 24h.
But this is the most dangerous time—don't let greed fool you! Let's break it down:
📈 1. Technical structure: Extremely overbought
• 4H & 1H charts: Huge green candles have risen continuously, accompanied by an explosive surge in trading volume. However, the current price (0.20) is now far above the EMA lines (the 1H EMA7 is at 0.179, and EMA25 at 0.119).
⚖️ 2. The danger of the "FOMO trap" (Order book)
• 1H chart: Longs account for as much as 64.65%.
• 4H chart: The Long/Short ratio is much more balanced (50.21% / 49.79%).
• Reading the situation: The crowd is FOMO-buying on the smaller timeframe (1H), afraid of missing out. Meanwhile, on the larger timeframe (4H), big money (whales/MMs) is in a tug-of-war and taking profits. A very likely scenario is that MMs will dump the price in a shakeout (Long Squeeze) down to the EMA7 zone, wiping out all the longs who bought the top before deciding whether to pump it again.
🎯 PRACTICAL TRADING STRATEGY:
1. ABSOLUTELY DO NOT CHASE THE PRICE (FOMO) RIGHT NOW: Buying at 0.20 after a 260% rally puts you at an extremely high risk of blowing up your account. The potential profit is small, while the risk is unlimited.
2. Wait for a Support Retest: The safest entry point is when the price pulls back to retest the 1H EMA7 zone around 0.17–0.18.
3. Resistance & Support (Key Levels):
• Resistance (High): 0.226
• Support 1 (Critical): 0.17 (1H EMA7)
• Support 2: 0.12 (1H EMA25) — If 0.17 breaks, the price could easily plunge
👇 Is anyone holding a Long or Short on this one? Check in and let's see who's sweating the most! 🥶
#BinanceSquare #QUSDT #QuackAI #pumpanddump