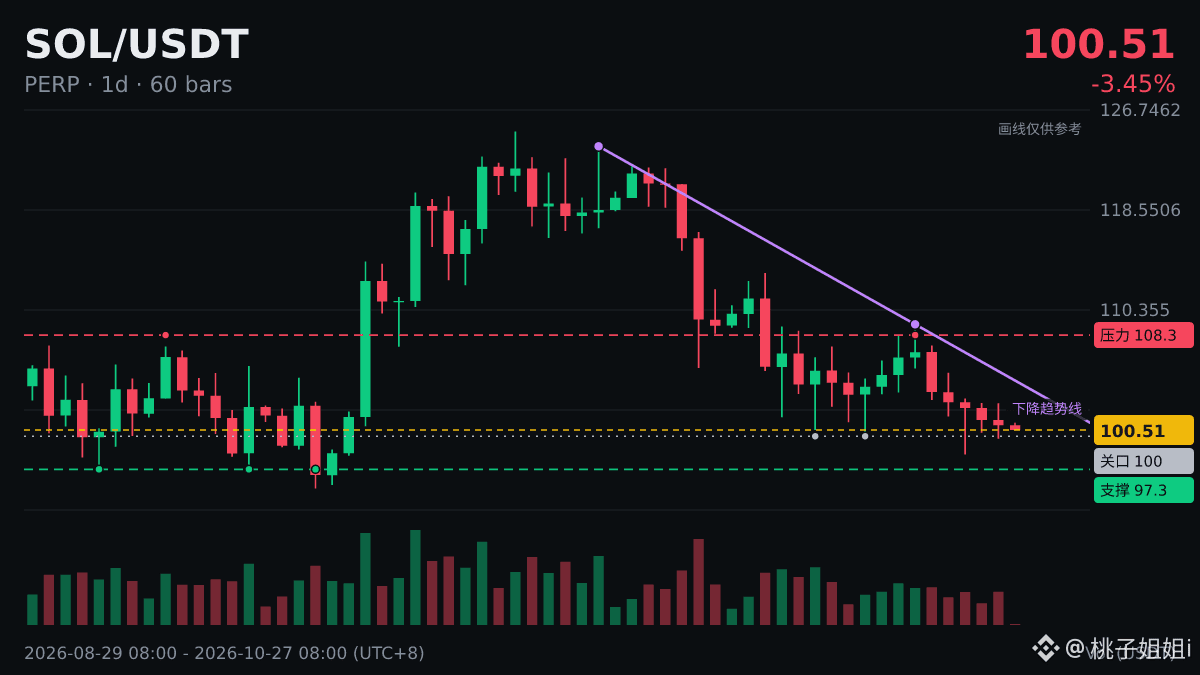
$SOL |5 consecutive bearish candles on the daily chart|cumulative -5.61%
Before looking at fund flows, first understand consecutive bullish and bearish candles.
A bullish candlestick is one where the closing price is higher than the opening price; a bearish candlestick is one where the closing price is lower than the opening price. Consecutive bullish candles means several days in a row closing with bullish candles.
When trading volume gradually increases over a run of consecutive candles, it is often seen as a sign that more people are participating; when volume gradually shrinks, it is often viewed as a sign that fewer people are following the move.
Understanding an indicator helps you avoid being misled by a single number; it is not a tool for predicting tops and bottoms.