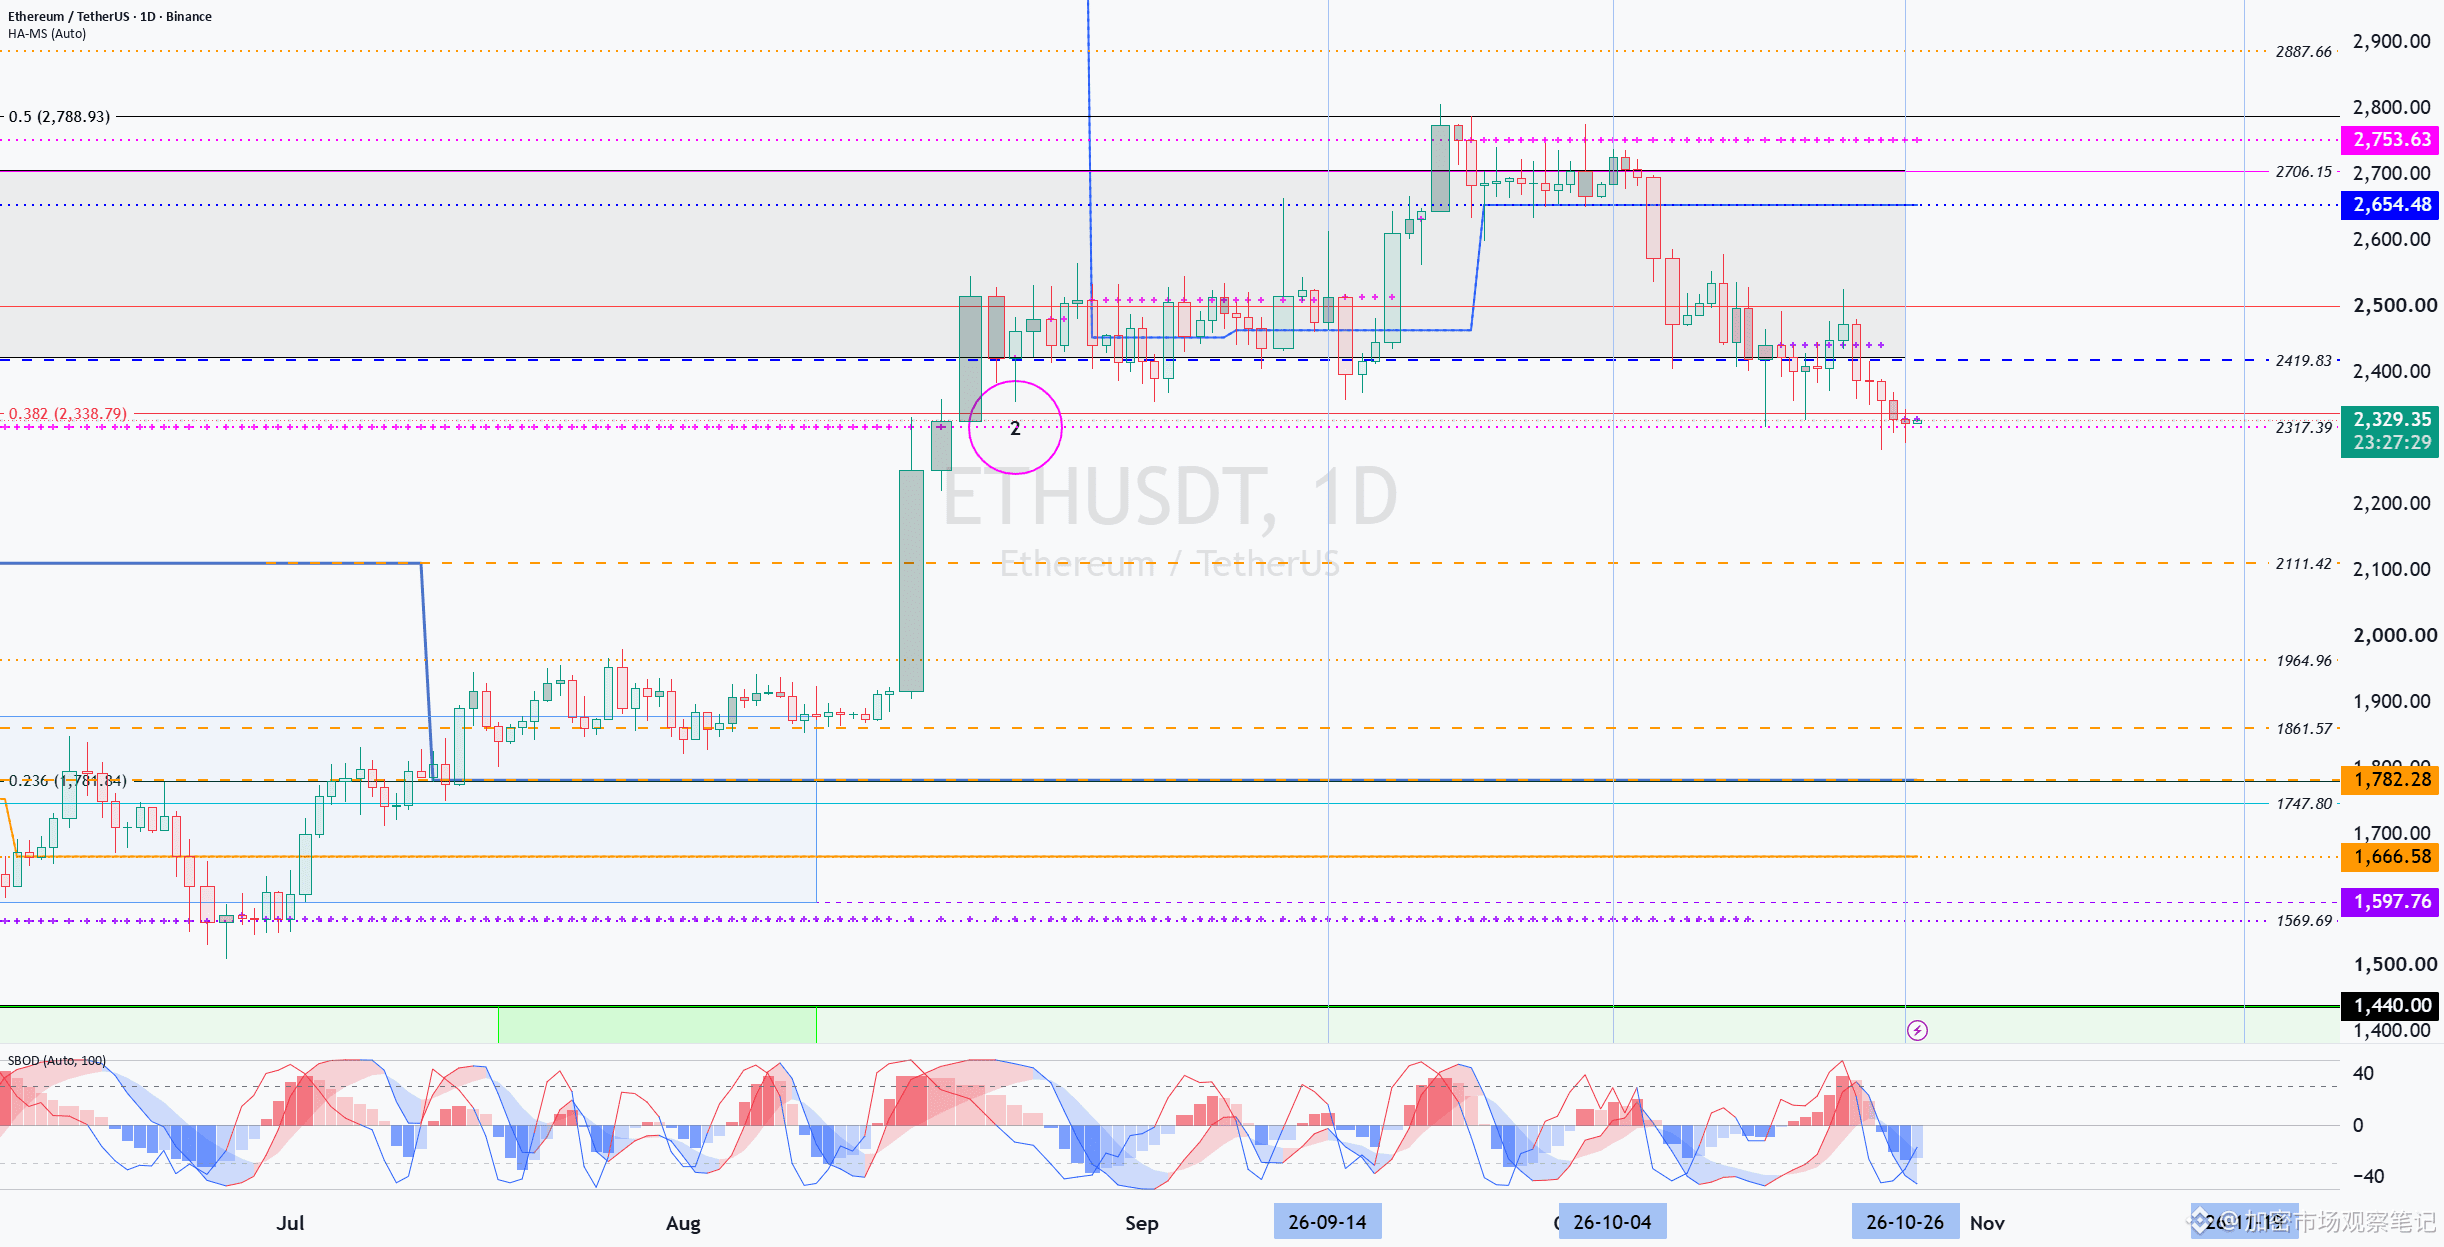
Big news! The author has their eye on ETH’s next phase of volatility, and the contrast is certainly striking: This chart analysis, published on October 27, 2026, says that the DOM(-60) indicator appeared near 2442.08 earlier, signaling a potential bottom, but the price failed to hold that level and continued to fall. The title points to a volatility window worth watching around November 19.
The author says that if the decline continues, the price may keep looking for the HA-Low indicator, with attention on whether support can form near 2111.42. HA-Low is designed to identify potential buying opportunities. By contrast, the move from HA-High down to HA-Low is the hardest phase to judge, because after the price falls from a high, it is difficult to know exactly how far it will drop.
The author also marks 2317.39 as a support and resistance level on the chart. Under their strategy, if the price breaks below this level and then meets resistance there, or a candle closes below it, traders could consider selling part of their position and waiting. If signs of a bottom then emerge, a bullish candle is about to close, and the price is no higher than the earlier partial-sale price, they could consider buying back in gradually. The author stresses that if the price rebounds immediately after selling, traders should not chase it higher to buy back in.
The author’s core idea is to buy in stages near HA-Low, sell in stages near HA-High, and use DOM(-60) and DOM(60) to identify potential bottom and top zones. For medium- to long-term participants, partial selling can be seen as setting aside funds for future repurchases; short-term traders may lock in profits at major sell levels and then wait for the next cycle. The author also recommends planning the first take-profit level in advance and setting a stop-loss once the price is above the average cost plus trading fees.
The outlook for ETH is neutral. The reasoning is that while the author believes a bottom may gradually form, they also explicitly acknowledge that the decline could continue, and that these support levels and indicators are personal technical analysis—not verified live market data or a firm prediction. In the author’s view, the outcome ultimately depends on how traders execute their own support and resistance strategy. Would you consider 2317.39 and 2111.42 key levels to watch?
$ETH
Source: TradingView Crypto Ideas
The author says that if the decline continues, the price may keep looking for the HA-Low indicator, with attention on whether support can form near 2111.42. HA-Low is designed to identify potential buying opportunities. By contrast, the move from HA-High down to HA-Low is the hardest phase to judge, because after the price falls from a high, it is difficult to know exactly how far it will drop.
The author also marks 2317.39 as a support and resistance level on the chart. Under their strategy, if the price breaks below this level and then meets resistance there, or a candle closes below it, traders could consider selling part of their position and waiting. If signs of a bottom then emerge, a bullish candle is about to close, and the price is no higher than the earlier partial-sale price, they could consider buying back in gradually. The author stresses that if the price rebounds immediately after selling, traders should not chase it higher to buy back in.
The author’s core idea is to buy in stages near HA-Low, sell in stages near HA-High, and use DOM(-60) and DOM(60) to identify potential bottom and top zones. For medium- to long-term participants, partial selling can be seen as setting aside funds for future repurchases; short-term traders may lock in profits at major sell levels and then wait for the next cycle. The author also recommends planning the first take-profit level in advance and setting a stop-loss once the price is above the average cost plus trading fees.
The outlook for ETH is neutral. The reasoning is that while the author believes a bottom may gradually form, they also explicitly acknowledge that the decline could continue, and that these support levels and indicators are personal technical analysis—not verified live market data or a firm prediction. In the author’s view, the outcome ultimately depends on how traders execute their own support and resistance strategy. Would you consider 2317.39 and 2111.42 key levels to watch?
$ETH
Source: TradingView Crypto Ideas