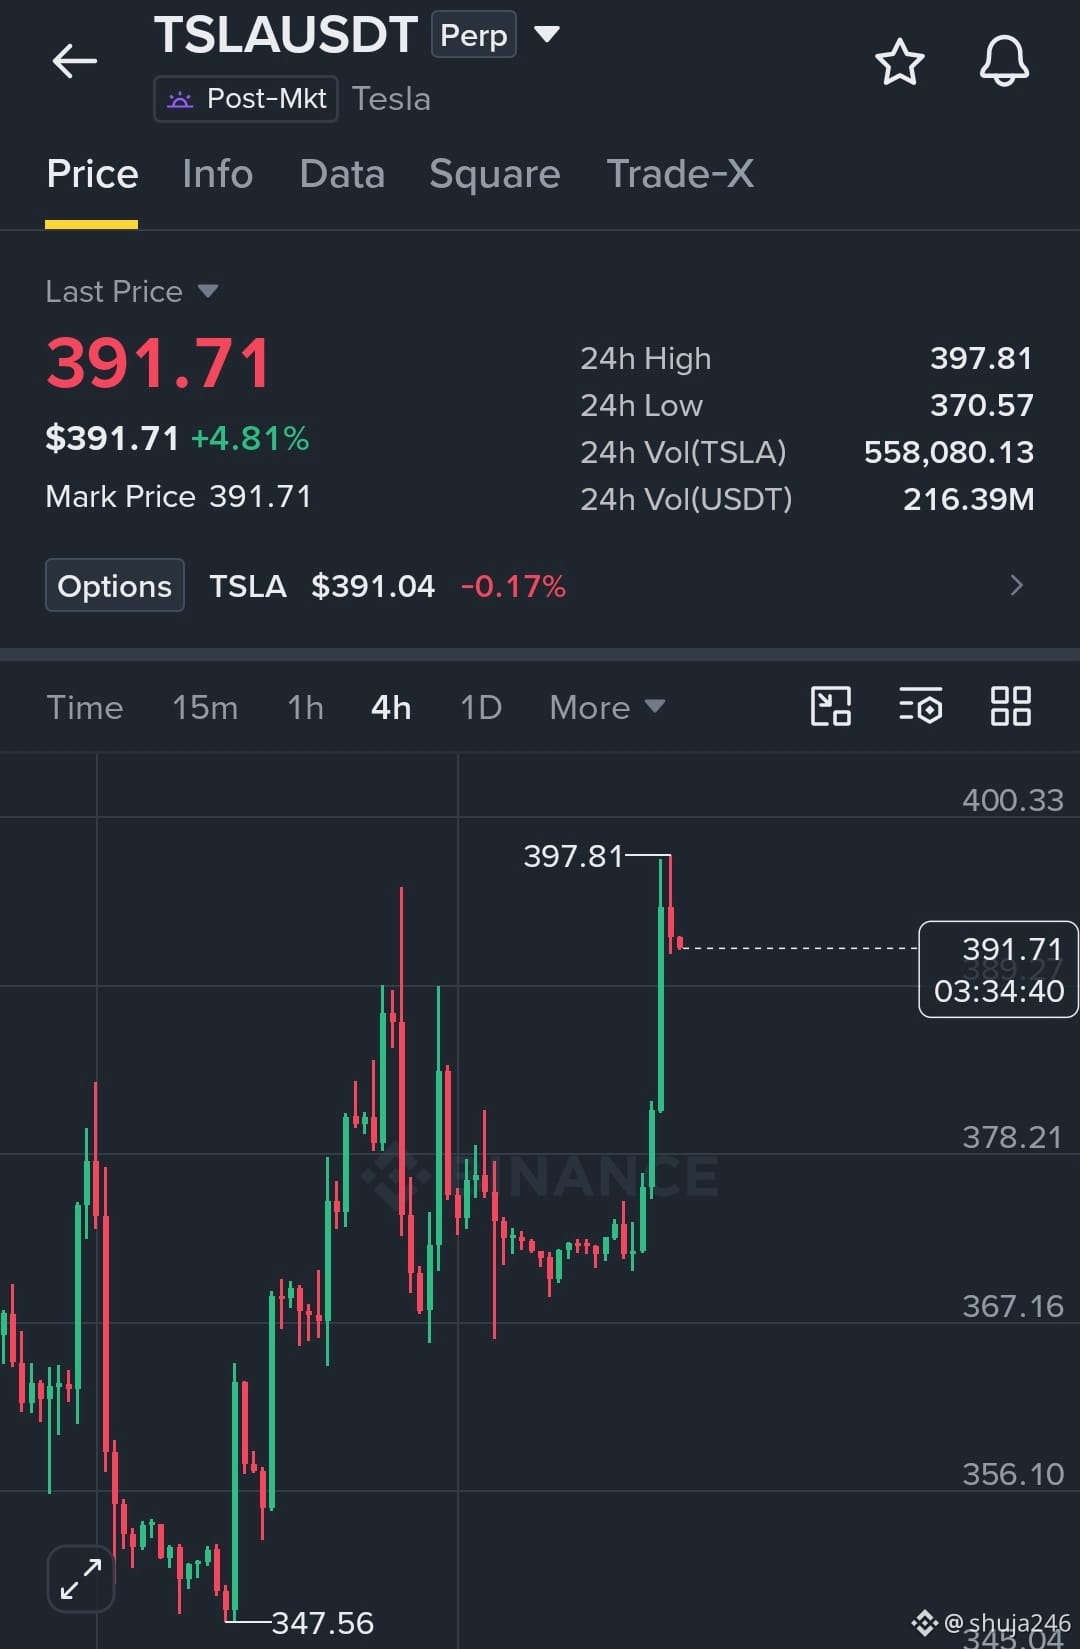
$TSLA has just made a huge bullish vertical move to a high of 397.47 (+4.90%).
However, what stands out is
The price gapped down to 347.51 low on Oct 19, after which it was range bound between 370.51 and 371.96 for three days. After this, it went vertical, breaking over 384.71 and 384.98 as it made a huge move up to the high of 397.47. We are now trading at 391.85 (very top of the expansion). The orderbook shows bullish pressure.
Live data from your TradFi chart Bybit | 1:17 AM:
Last Traded: 391.85 (+4.90%) Mark: 391.82
High: 397.47 Low: 370.51 Turnover: 29.18M (24H)
Most importantly,
The price is now trading well above the BOLL(20,2) and all MAs. From your charts:
RSI6: 1H: 58.08 2H: 70.48 4H: 82.40 1D: 76.78
We can see momentum is strong. However, looking at the 4H chart, RSI6 is at 82.40, meaning we are in a blow off phase. Looking at the 1D chart, we have a long way to go before we hit the top of 453.60 from June. This is a bounce rally, not a new ATH.
This looks like a bullish post-expansion trade. However, buying at 391.85 would be a poor risk/reward. You would need to place your stop below 384.98 just to protect against normal volatility. Proper swing stop would be below 370.51.
If we retrace and the price hits 384.98 and forms a bullish rejection wick, then it would present a good opportunity to buy long to continue the trend. Buy here is FOMO.
I am keeping an eye on 384.98 and 370.51 (24h low). If we hold above 384.98 then we will continue higher towards breaking the high of 397.47 and hitting 410+. If we hit below 370.51 then we will gap back down to between 346.46 and 353.00.
I am not buying $TSLA at the top. I want to see if bulls can hold 384.98.
Do you want to wait for a retrace or take profits?
Click to trade $TSLA
#TSLA @Binance Square Official @Binance Square Official @Binance Announcement @Binance Live @CZ