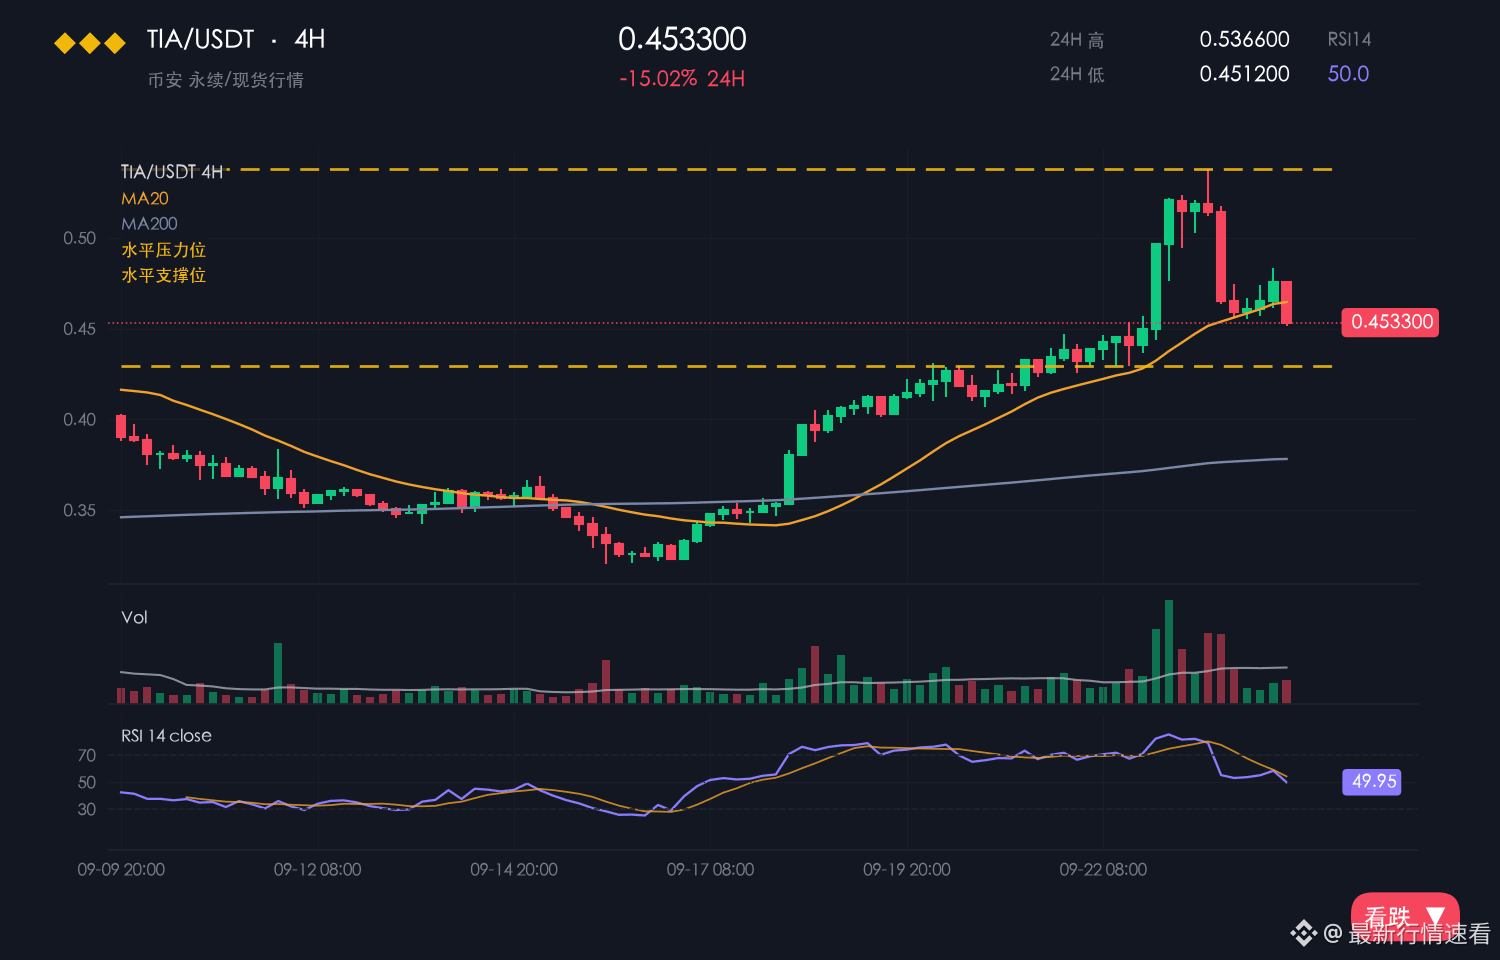
TIA is currently at 0.6184, down 1.14% over 24 hours but still up 11.00% over 7 days. The intraday range is 0.6062–0.6595, with an 8.8% amplitude.
【Market Action】
According to Binance spot market data, most of TIA’s turnover in this move took place between 0.6062 and 0.6595.
Key takeaway: The 8.8% amplitude and 0.6062–0.6595 range indicate that positions are changing hands at these price levels.
TIA moved lower throughout the day from 0.6595 to 0.6062, while the rebound was clearly on low volume.
There are no signs yet that the short-term weakness has reversed, and selling pressure continues to be released.
Compared with BTC’s +0.95%, TIA ranks at the bottom in relative strength, putting it among the market’s most neglected assets.
【Macro】 U.S. stocks fell overnight: Nasdaq -1.88%, S&P 500 -1.11% (2026-10-14 close). BTC ETFs have seen net outflows of around $45.2 billion this month, while U.S. CPI came in above expectations at 3.7% year over year. The probability of a rate hike at the 2026-10-27/28 policy meeting is around 47%. Spot BTC ETFs have seen net outflows of around $45.2 billion this month, as institutional buying has faded.
The short-term outlook leans bearish.
【Bearish Case】
Medium-term view: Watch how price behaves around 0.6062; don’t follow short-term sentiment.
After sliding from 0.6595 to around 0.6184, the short-term center of gravity is still moving lower.
One data point hasn’t been priced in: the 11.00% seven-day rate of change.
$TIA #TIA